

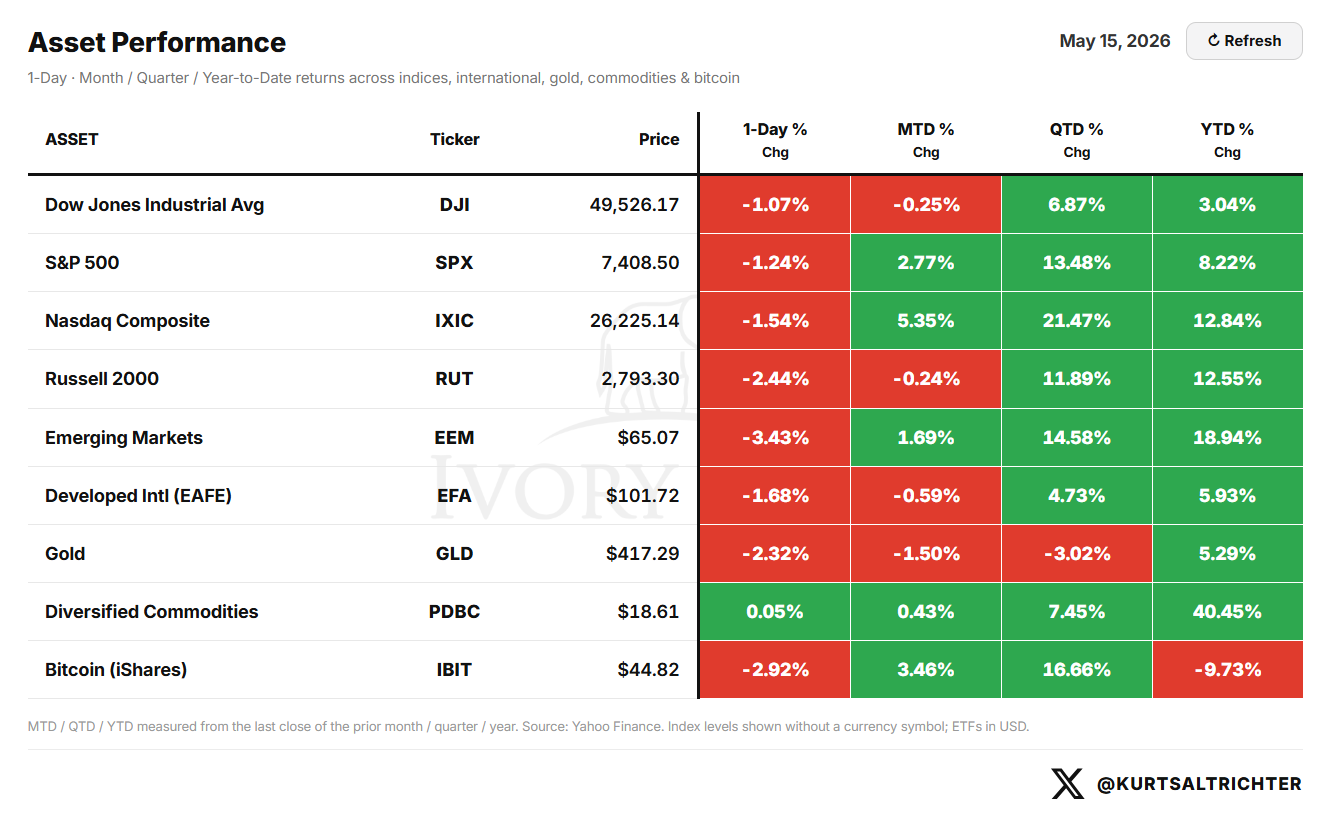
The S&P 500 made new highs this week before Friday’s selloff pulled the market back to 7,409. The week finished up just 0.13%. SPX bounced right off of our +1σ weekly expected move (that was posted in last week’s report) at 7,511 on Thursday, then reversed hard on Friday, down 1.24% on the session. The signal has been risk-on for six consecutive weeks. NVIDIA reports after the close on Wednesday. Everything else this week fills in around it.
THE ECONOMIC EVENT CALENDAR AND VOL TERM STRUCTURE
The SPX implied vol sits at 11.54% as of May 15. The term structure slopes upward as macro events accumulate across expirations.
Thursday, May 21: Building Permits, Housing Starts, Initial Jobless Claims (week ending May 16), and the Philadelphia Fed Manufacturing Survey. All four are medium impact. SPX IV for that expiration is 15.21, implying ±1.95%.
Friday, May 22: Michigan Consumer Sentiment. SPX IV steps to 15.24, implying ±2.11%. Reflecting less downside hedging at that event.
The first high-impact event on the visible calendar is Consumer Confidence, scheduled for May 26. SPX IV at that expiration is 13.98, implying ±2.43% move up or down.
The heaviest macro load lands next week, May 28: Core PCE, GDP, PCE Price Index, Durable Goods Orders, Personal Income, Personal Spending, and New Home Sales. SPX IV at the May 28 expiration is 14.81, implying ±2.79%.

The term structure is not pricing fear. It is pricing event risk in a measured, upward-sloping shape. That is the behavior of a market that sees risk ahead without having lost confidence in the current regime.
Bottom line: This week’s economic data is priced for modest moves. The bigger test comes May 26 through 28 with Consumer Confidence, GDP, and PCE landing in a tight window.
OpEx was on Friday, May 15
Monthly OpEx landed last week on Friday. An estimated $2.25 trillion in SPY/SPX open interest expired with it.
Here is how it works. Every options contract has an expiration date. As that date approaches, the gamma tied to those contracts peaks. The dealers who sold those options are delta-hedging continuously, buying dips and selling rips to stay neutral. This is a mandate. That mechanical hedging is what creates the pinning behavior you see into expiration. Price gravitates toward strikes with the heaviest open interest because dealer hedging flows are most concentrated there.
When those contracts expired on Friday, that gamma disappears. The hedges get unwound. The mechanical support evaporates. We are in the window to watch what is happening. What happened on Friday does not matter, but the days that follow. Post-OpEx, the market moves more freely with less structural influence from dealer hedging. Historically, that has produced a 3- to 5-day window of higher volatility and larger directional moves as investors rebuild their positioning from scratch.
The more important window is this week. Once expiration clears, gamma rolls off and the market moves more freely with less mechanical support from dealer hedging. That is when price discovery gets more honest.
OpEx has been a weaker structural force in 2026 than in prior years. The reset has mattered less. Keep that in the back of your mind before leaning too hard on the gamma rolloff thesis heading into next week.
EARNINGS: WEEK OF MAY 18th
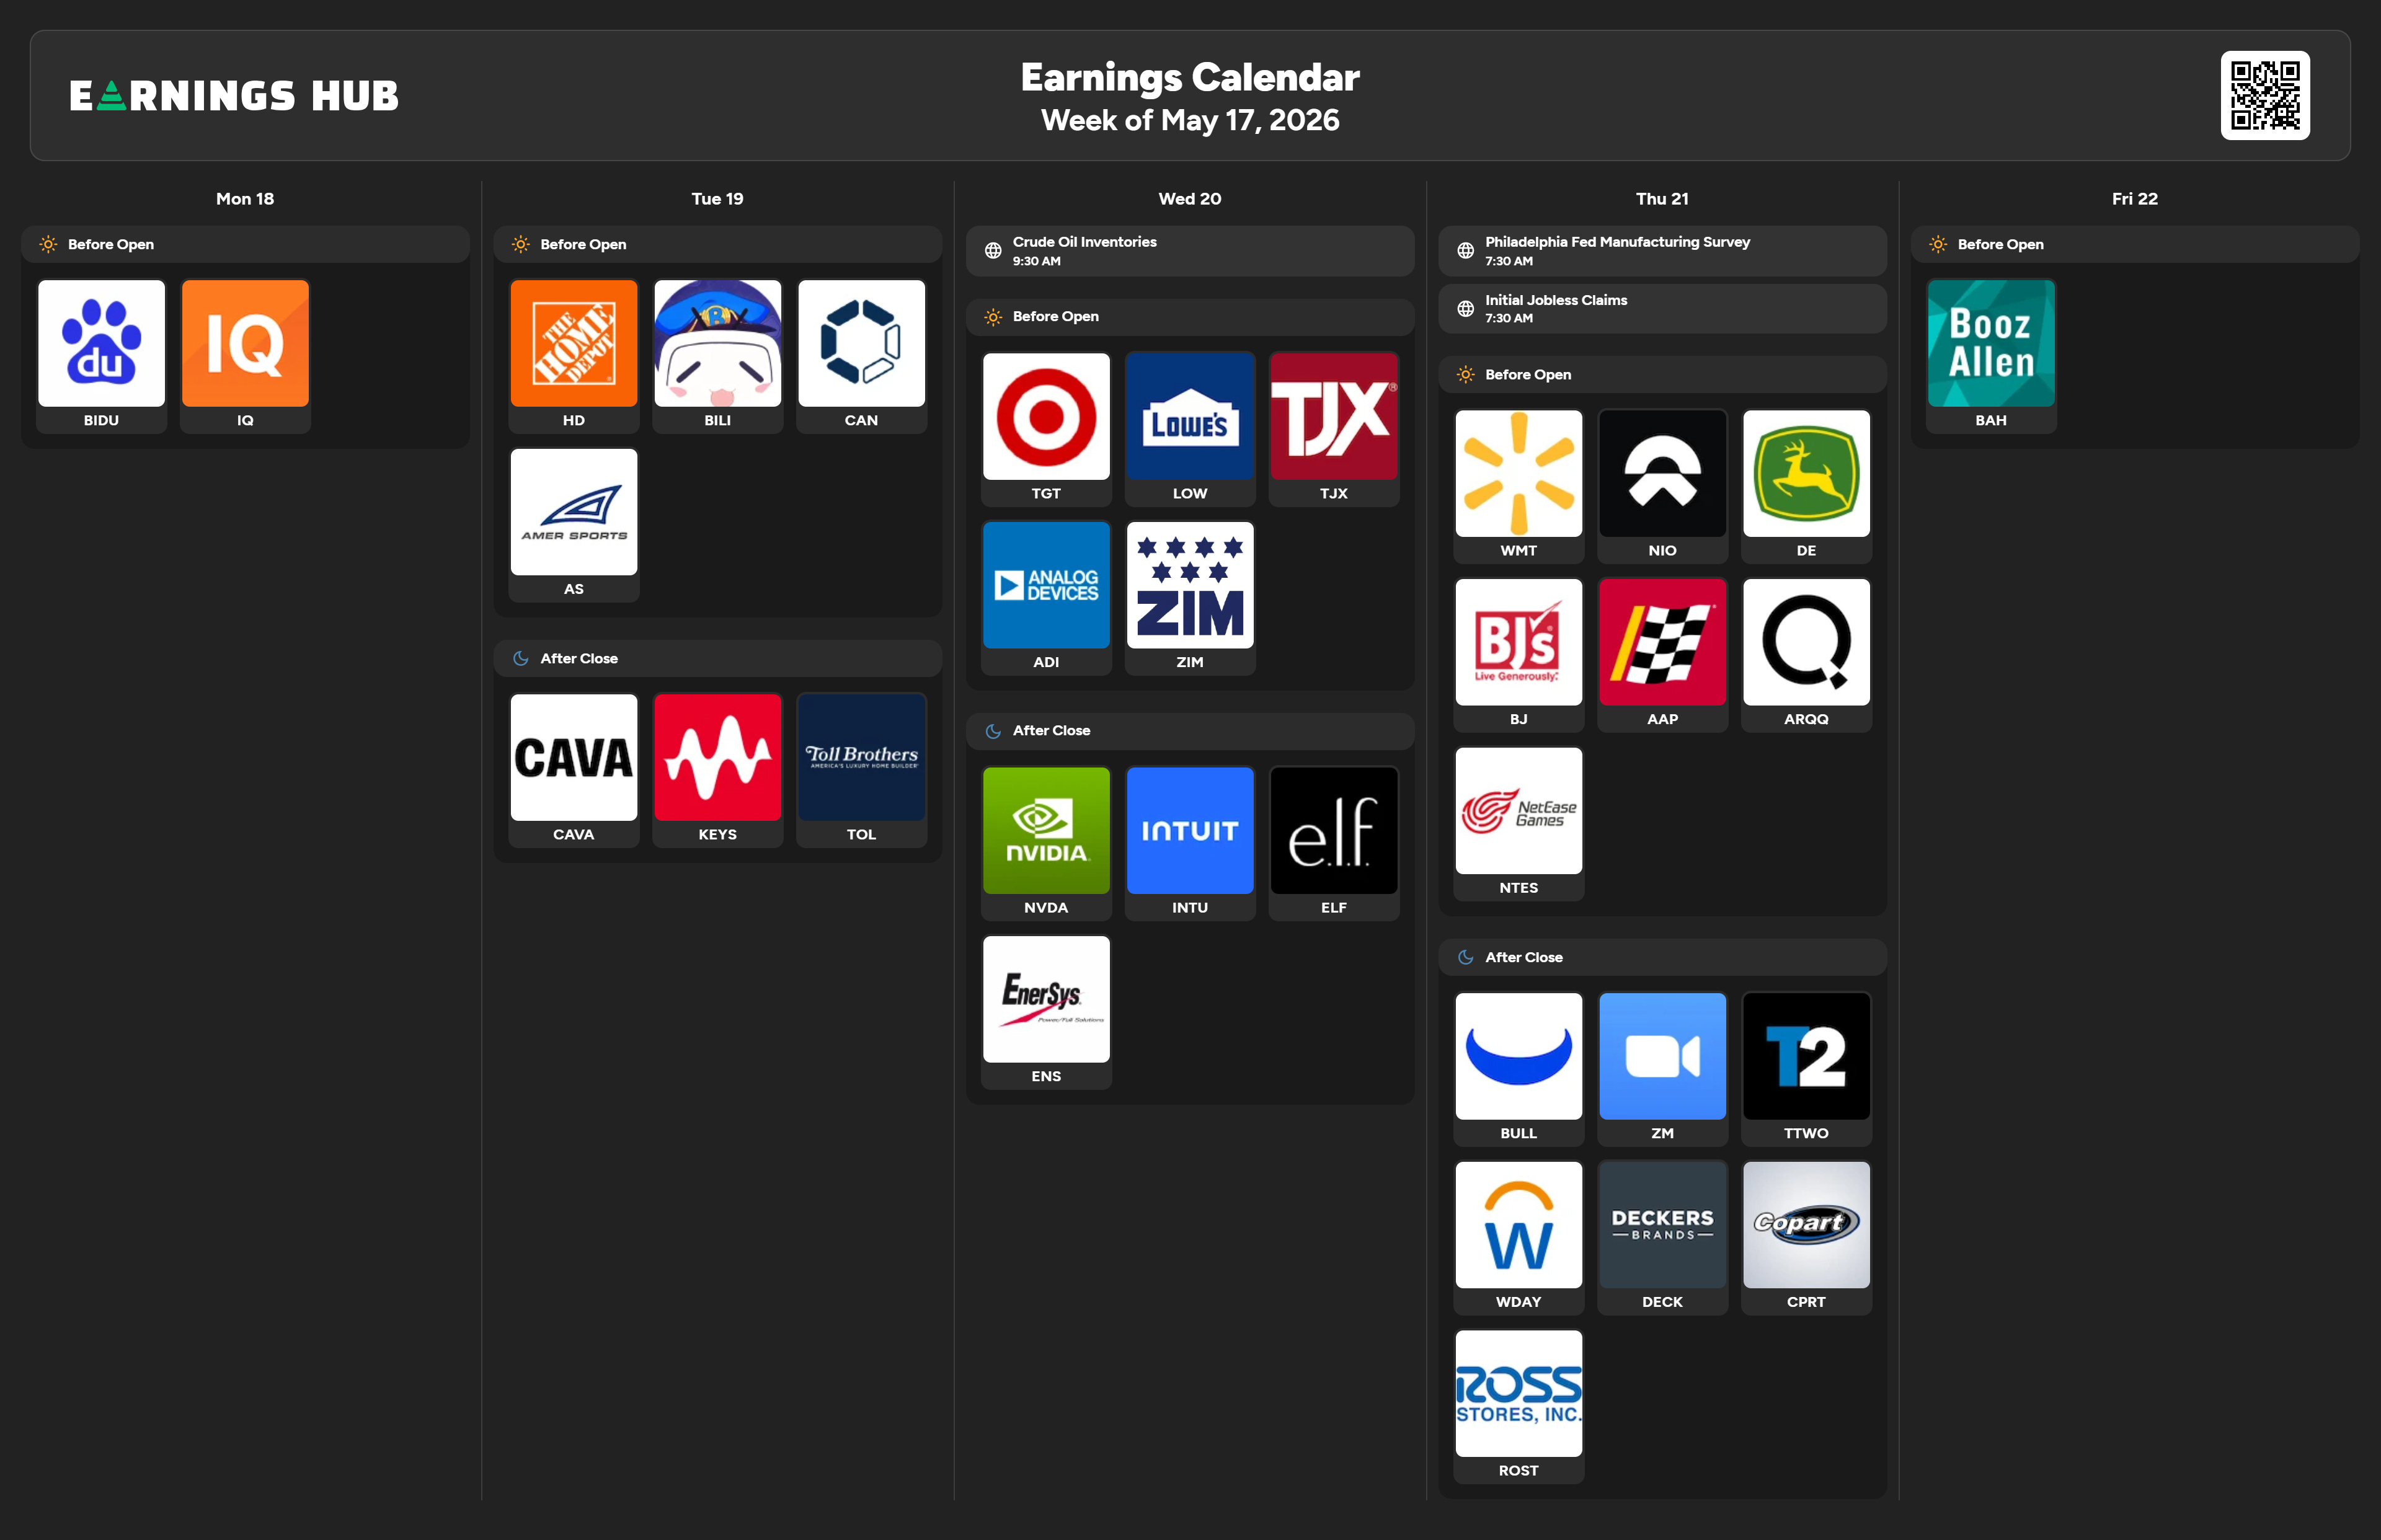
Monday, May 18: BIDU and IQ before the open. CAVA, KEYS, and Toll Brothers (TOL) after the close. Keep your eye on CAVA earnings today.
Tuesday, May 19: Home Depot (HD) before the open. HD is the first major consumer read of the week. Strong results support the SPHB thesis through Consumer Discretionary. Weak results signal that the high-rate, high-cost environment is pinching the consumer. BILI and CAN also report before the open. Amer Sports (AS) after the close.
Wednesday, May 20: Crude Oil Inventories at 9:30 AM. Before the open: Target (TGT), Lowe’s (LOW), TJX Companies (TJX), Analog Devices (ADI), and ZIM. Three large-cap retailers in one session give you a comprehensive read on consumer spending, pricing power, and inventory dynamics. After the close: NVIDIA (NVDA), Intuit (INTU), and ELF Beauty (ELF). NVIDIA is the dominant event of the week. A strong print accelerates the XLK trade and supports SPHB’s Information Technology exposure. A miss or soft guidance introduces volatility into a rally that finished last week up just 0.13% on the index. As always, the market expects NVDA to deliver, so if they don’t, watch out below. NVDA is the stock market.
Thursday, May 21: Walmart (WMT), NIO, Deere (DE), BJ’s Wholesale (BJ), Advance Auto Parts (AAP), and ARQQ before the open. WMT is the best single proxy for mass-market consumer health. After the close: Workday (WDAY), Deckers (DECK), Copart (CPRT), Ross Stores (ROST), Zoom (ZM), and Take-Two Interactive (TTWO).
Friday, May 22: Michigan Consumer Sentiment at 7:30 AM. Booz Allen Hamilton (BAH) before the open.
NVIDIA Wednesday night is the structural event that will drive the rest of the week. Home Depot on Tuesday and Walmart on Thursday bracket it with consumer data. The earnings calendar gives you a full read on enterprise tech, home improvement, and mass-market spending in five sessions.
MOMENTUM PULSE CHECK
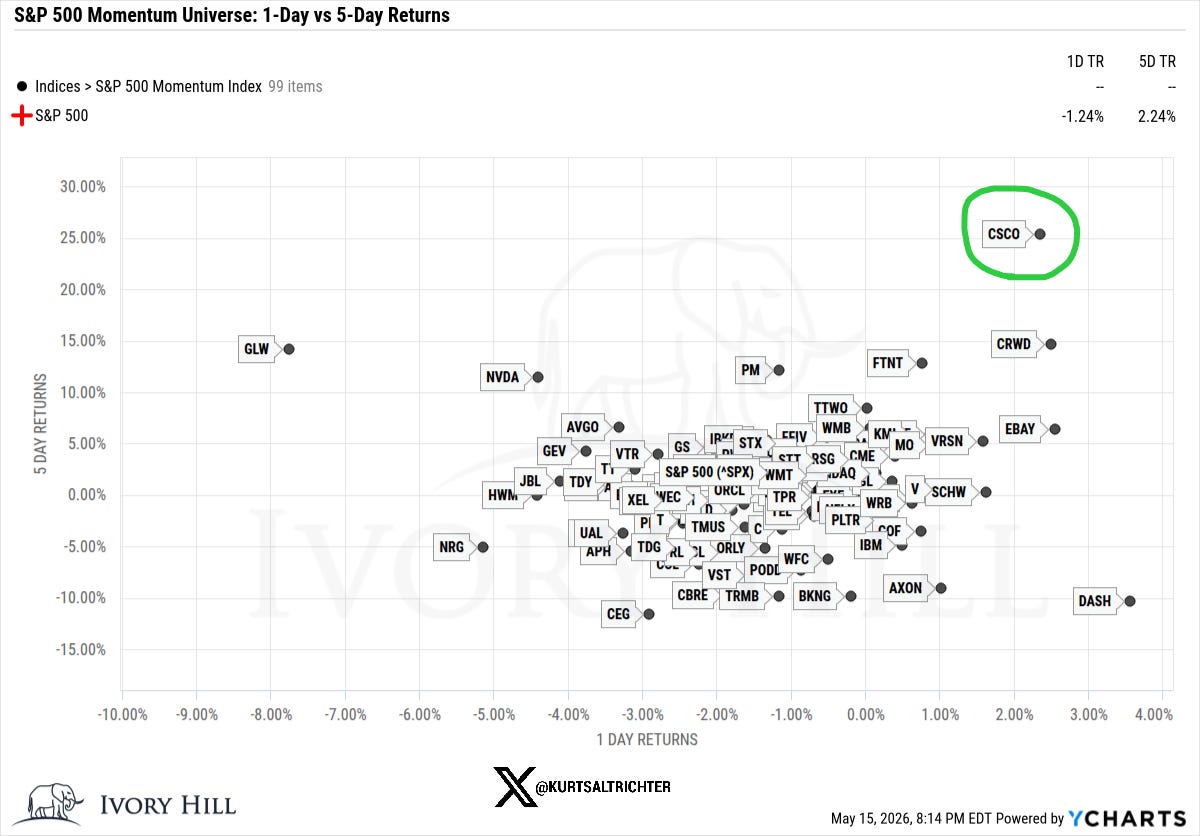
CSCO 0.00%↑ led the 5-day return column near +25%, followed by CRWD 0.00%↑ and GLW 0.00%↑. Technology and cybersecurity names dominated the right side of the chart on the 5-day window. On the 1-day axis the picture reversed broadly. NVDA 0.00%↑ pulled back roughly 5%. DASH 0.00%↑ was the weakest name in the universe on the day. The broad field tilted negative on Friday.
The names holding up best across both timeframes are CSCO, CRWD, PM 0.00%↑ and FTNT 0.00%↑ . CSCO’s earnings Wednesday night confirmed the enterprise IT spending story. Watch whether that leadership extends into NVIDIA’s print.
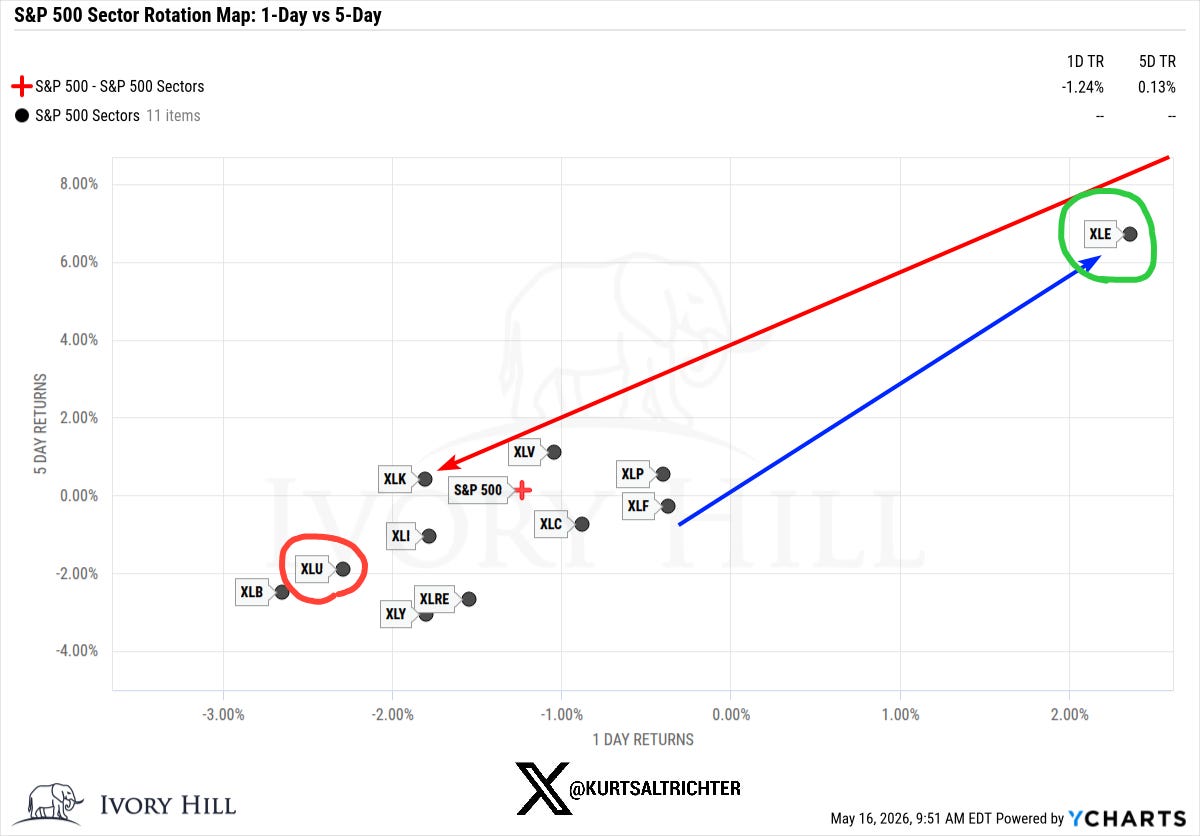
Energy XLE 0.00%↑ was the dominant outlier on the week, posting roughly +6.7% on the 5-day window with a positive 1-day return near +2.1% on Friday while everything else sold off. That is a notable divergence. XLE held bid on a day when the rest of the market gave back ground.
XLK 0.00%↑ was essentially flat on the week and down roughly 2% on Friday. The S&P 500 finished the week up just 0.13% with a 1-day loss of 1.24%. Every other sector posted a negative 1-day return.
That rotation, out of technology and into energy, is the story of Friday’s session and worth watching as the week opens.
It is also worth pointing out that utilities (XLU) lagged most of the week. That is not typically bearish.
If NVIDIA delivers on Wednesday, XLK reasserts leadership, and that rotation reverses. If NVIDIA disappoints, the rotation into energy and defensives has more room to run. In this regime it pays to be long both.
MARKET STRUCTURE: THE ANCHOR POINT
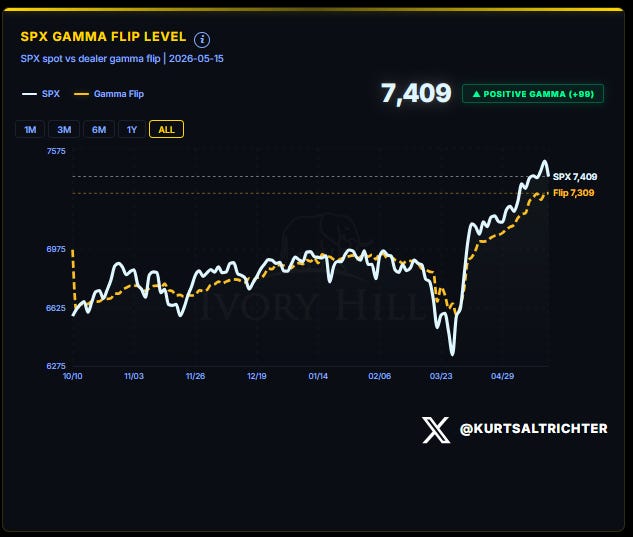
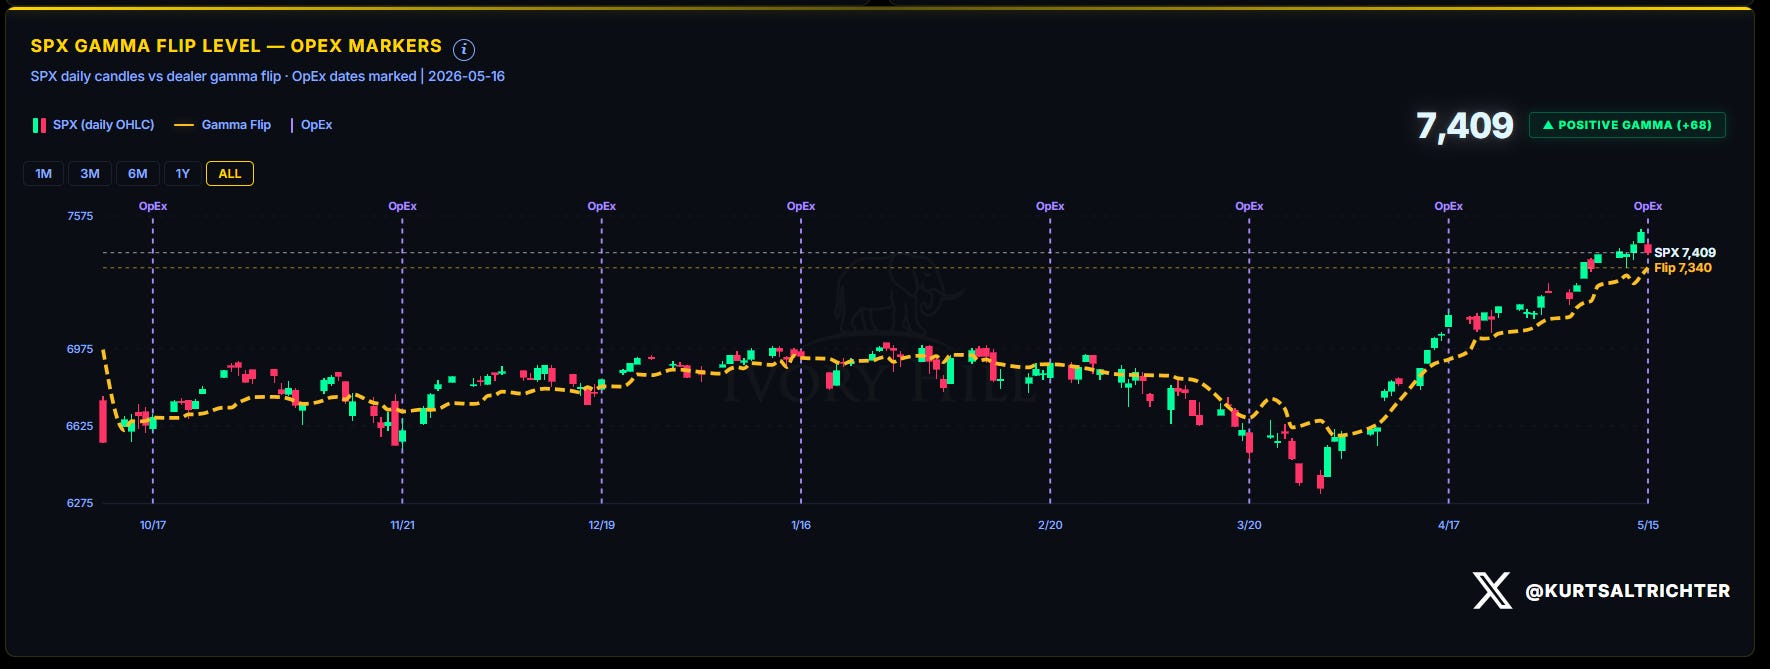
The S&P 500 closed Friday at 7,409. The gamma flip is at 7,309. Dealers are operating 100 points above the flip in positive gamma territory.
Dealers are long gamma when SPX sits above the flip. That posture means they sell into strength and buy into weakness, suppressing intraday swings and producing the grinding, low-volatility price action that has defined this recovery off the April lows.
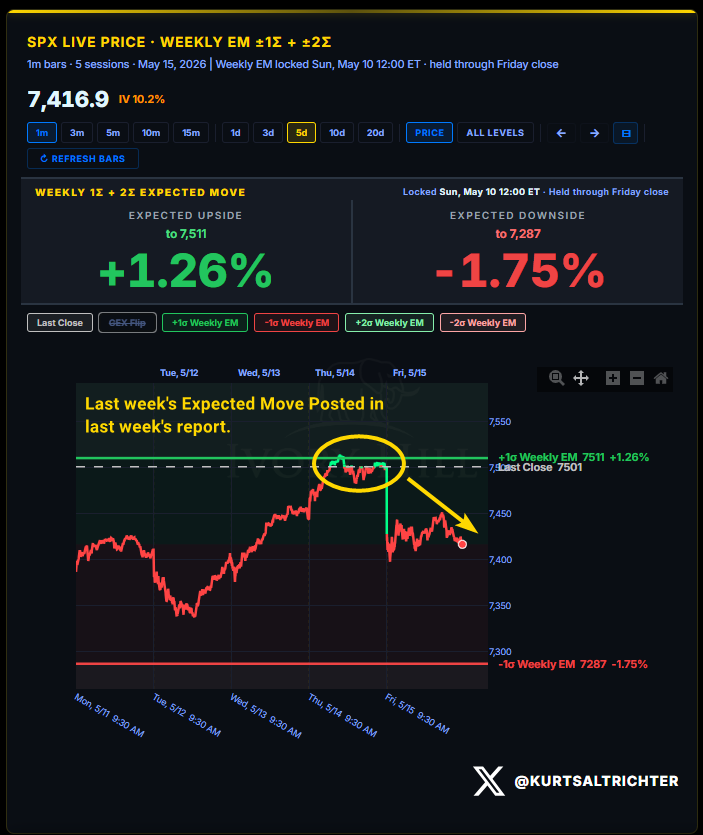
Last week illustrated exactly why we track the expected move every week. The +1σ upside level was posted in Issue 31 at 7,511. SPX tagged that level on Thursday, May 14, then reversed and closed Friday at 7,409. The market did not blow through it. It stalled at the level where dealer hedging mechanics create the most resistance, where options sellers are most concentrated, and where dealers are most aggressively selling into strength to hedge their books.
The expected move is not a price target. It is a gravity band. Price tends to mean-revert from the edges because the options positioning that defines those levels creates real hedging flows in the opposite direction. Knowing that level in advance tells you where to expect the market to stall or reverse. When price reaches the +1σ or -1σ boundary and fails to close through it, the odds favor a return toward the middle. That is what happened Thursday into Friday. I use these as opportunities to trim winners and on the high end and incrementally add on the lower end.
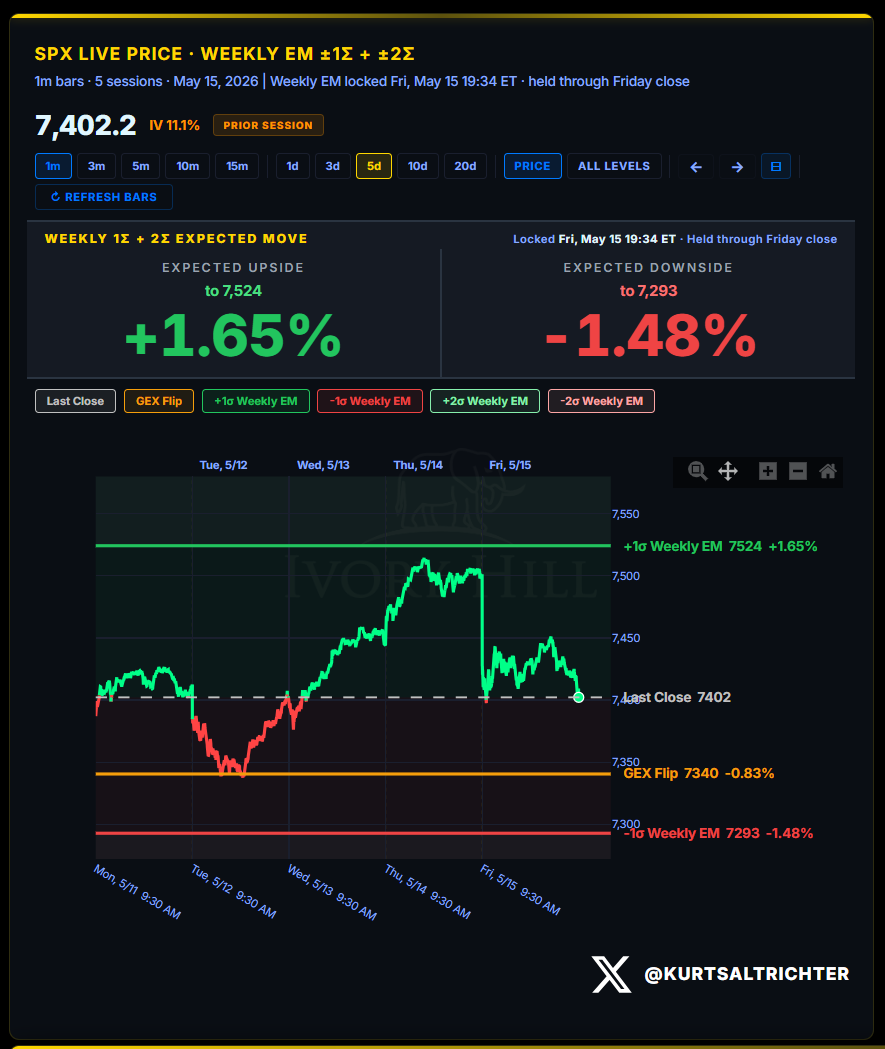
The weekly expected move for the week of May 18: upside to 7,524 (+1.65%), downside to 7,293 (-1.48%).
A closing breach of 7,293 pushes SPX back into negative gamma and moves dealer hedging from stabilizing to amplifying. That is the level to watch this week. This is the first time in a while the flip line is inside the weekly expected move, so we could enter negative gamma this week following Friday’s OpEx.
VOLATILITY REGIME
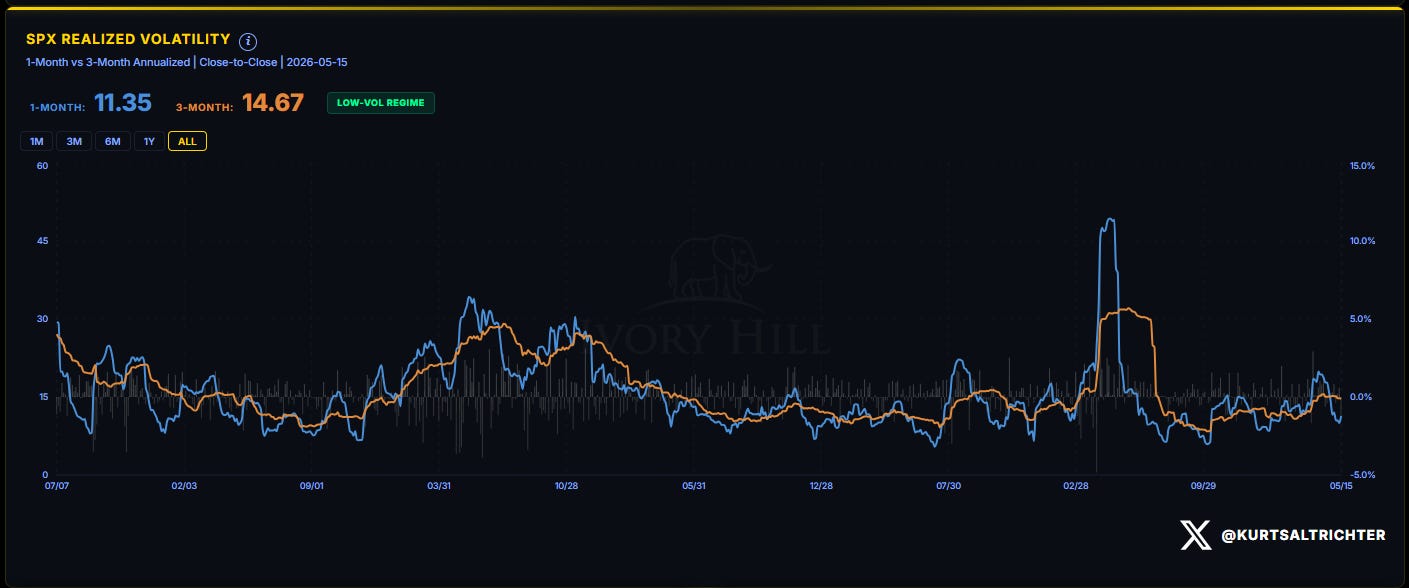
The 1-month realized vol printed 11.35. The 3-month is 14.67. The regime tag is LOW-VOL.
Friday’s 1.24% decline nudged the 1-month RV higher from mid-week lows. One down day does not break a low-vol regime.
Vol-control funds respond directly to these inputs. Their equity allocation algo increases equity exposure mechanically as realized vol falls and sells it as vol rises. At 11.35 on the 1-month, the algo still points toward elevated equity exposure.
The conditions that flip the vol signal: a sustained move in the 1-month RV above the 3-month. That is not happening today.
Low realized volatility acts as fuel for certain institutional investors. When volatility is low, their algos automatically push them to buy more equities. Friday’s minor vol uptick does not change the overall picture. The engine is still running.
SYSTEMATIC FUND FLOWS
CTA Positioning
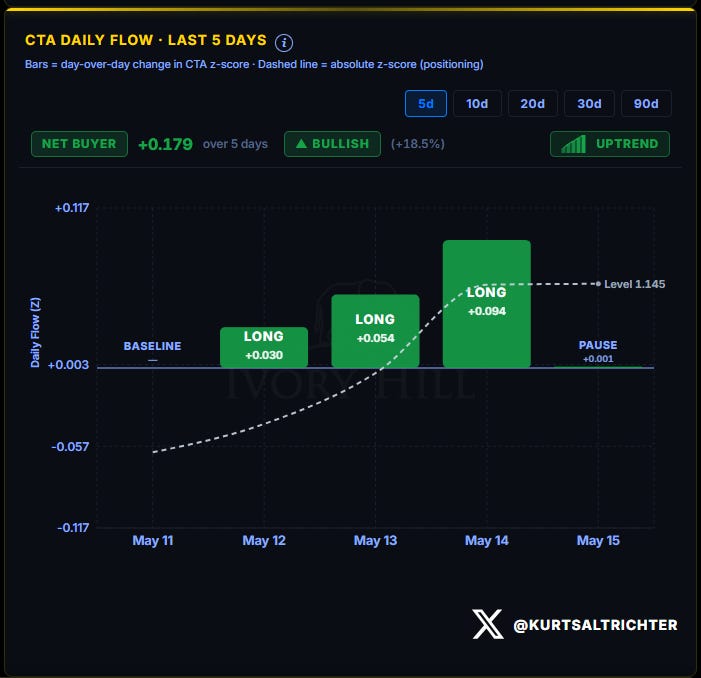
CTAs were net buyers over the past five days, adding a cumulative +0.179 to their positioning level. The absolute level now sits at 1.145. Four consecutive buying days were followed by a near-flat pause on Friday (+0.001). That pause is digestion after a week of consistent buying.
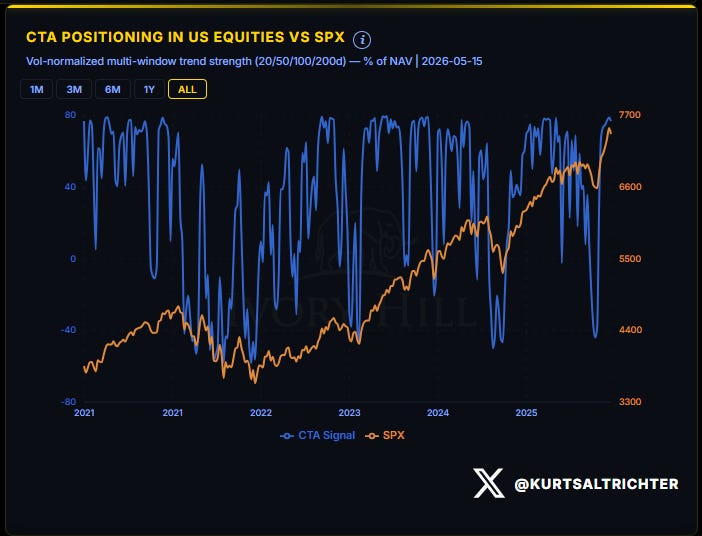
The longer-term picture shows how far CTAs have traveled. From late March through early April, CTA positioning in US stocks collapsed to levels not seen since the 2022 bear market. The rebuild has been aggressive, tracking the SPX recovery almost step for step. CTAs are now positioned long and adding to strength. The pace of that adding will slow as positioning becomes more extended, but the direction has not changed.
Vol-Control Positioning
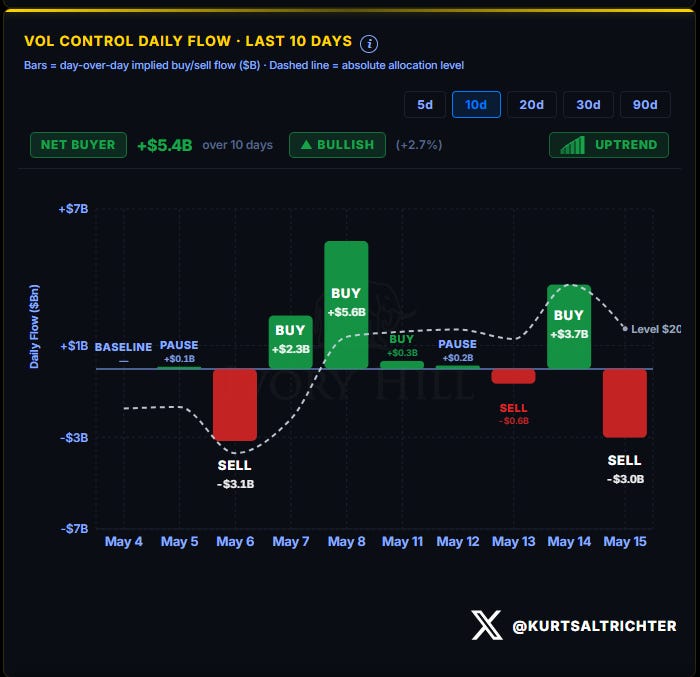
Vol-control funds were net buyers of $5.4 billion over the past ten days. The daily flow was not linear. May 13 added $3.7 billion. May 15 posted a $3.0 billion sell. That Friday sell is mechanical, not a directional call. When realized volatility ticks up on a down day, the formula automatically trims equity exposure. The current implied allocation sits near $200 billion against an estimated $300 billion AUM cap. Roughly one-third of capacity remains undeployed.
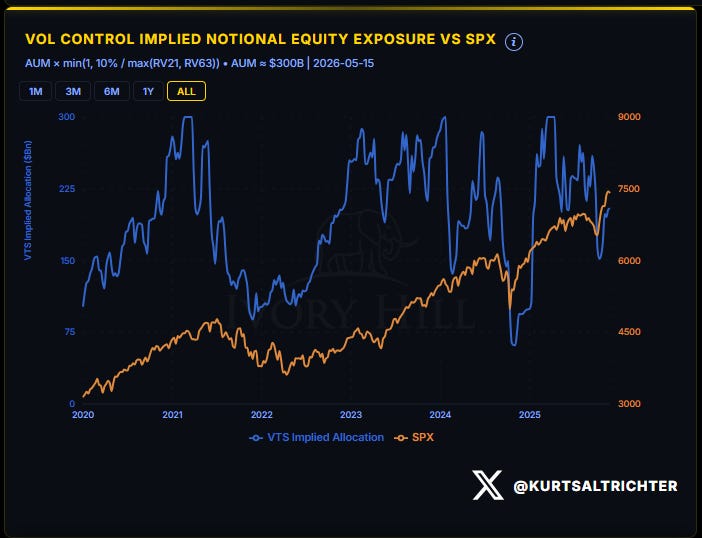
The longer-term chart puts that $200 billion in context. At the 2021 peak and again in early 2024, vol-control allocations ran near $275 to $300 billion. Today’s level is meaningfully below those prior highs. That gap is dry powder. If realized volatility continues to fall, the algo automatically pushes more capital into stocks. That is a structural tailwind that remains active as long as the low-vol regime holds.
Vol-control funds are autopilot investors. Low volatility means they buy equities automatically. High volatility means they sell automatically. Two-thirds of their budget is currently deployed. The remaining third flows in if volatility stays contained.
Systematic Positioning Index
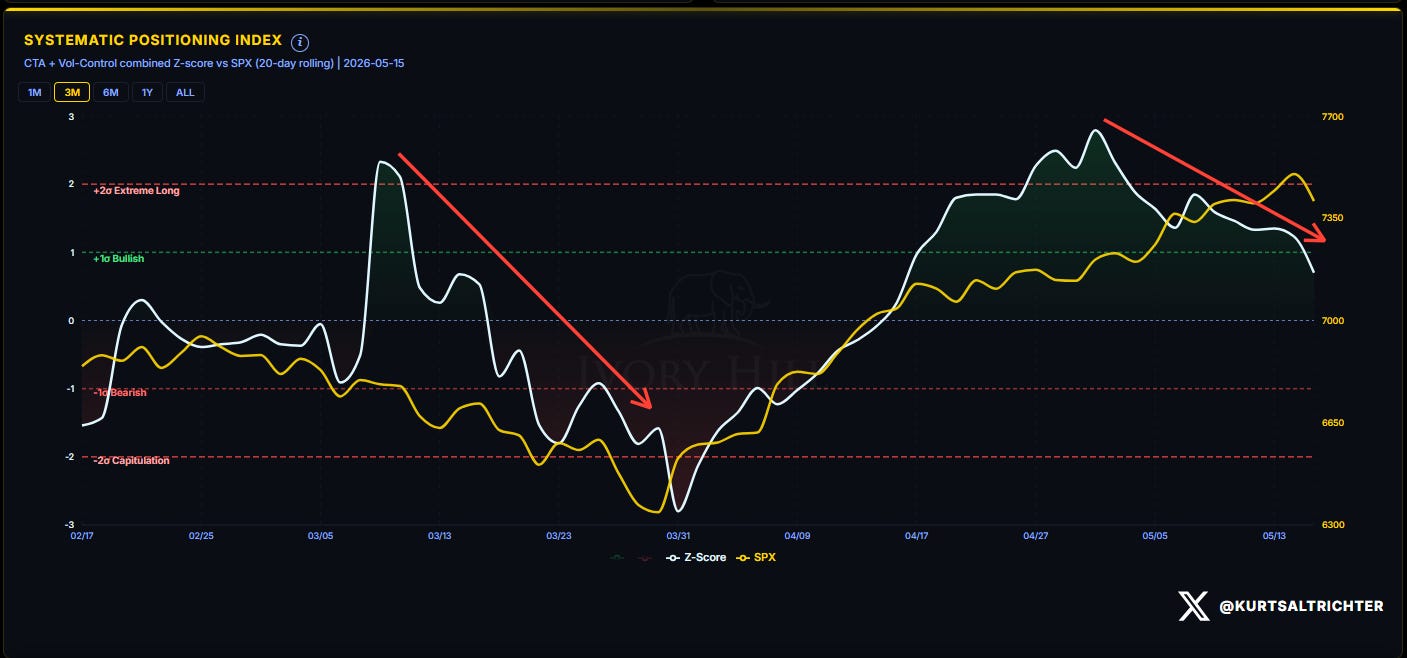
That pullback is the natural result of Friday’s price action feeding into the rolling calculation. The regime is still Bullish on systematic positioning. The risk is that, at these levels, the marginal buying pressure from CTAs and vol-control combined begins to slow and shift toward the downside. The big buying move is largely behind us. What remains is incremental adding, and a volatility shock from an event that forces both cohorts to mechanically sell simultaneously.
MARKET BREADTH
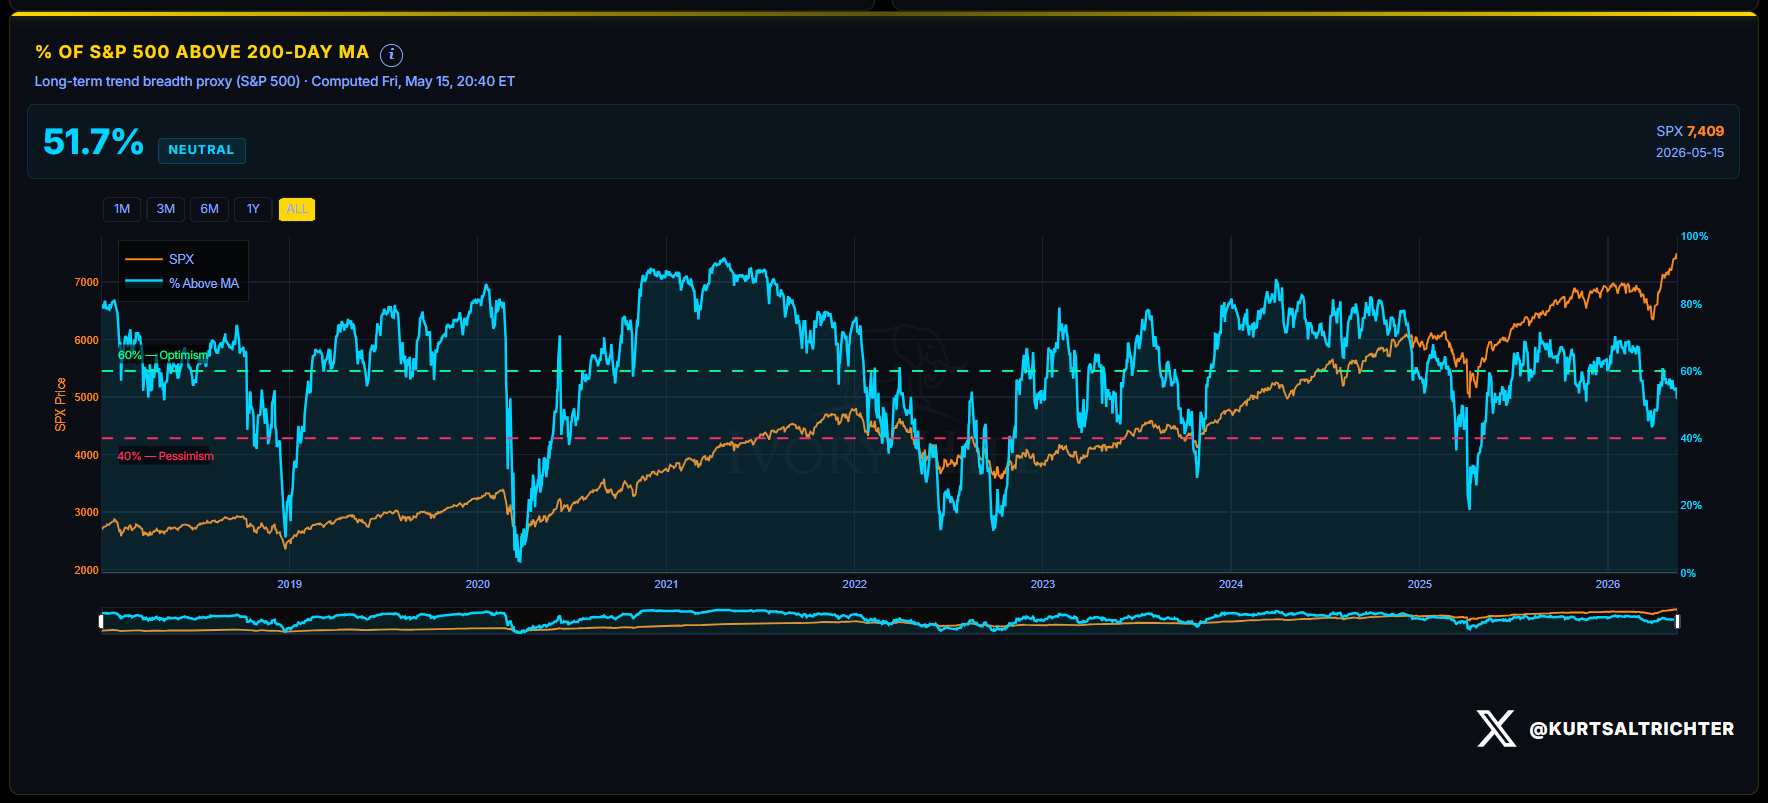
Breadth slipped to 52% of S&P 500 members trading above their 200-day moving average. The signal reads Neutral. It was 55% last week.
At 52%, we are mid-band and trending lower.
Breadth expanding above 60% would confirm the rally is healthy at the index level.
DEALER GAMMA DASHBOARD
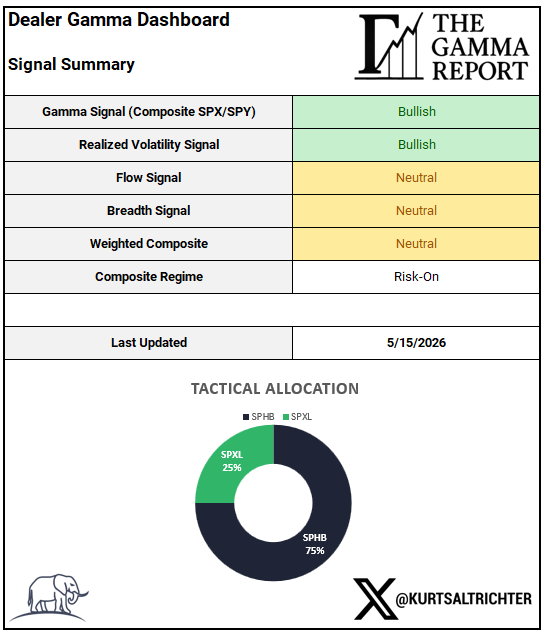
Tactical Allocation: 75% SPHB / 25% SPXL
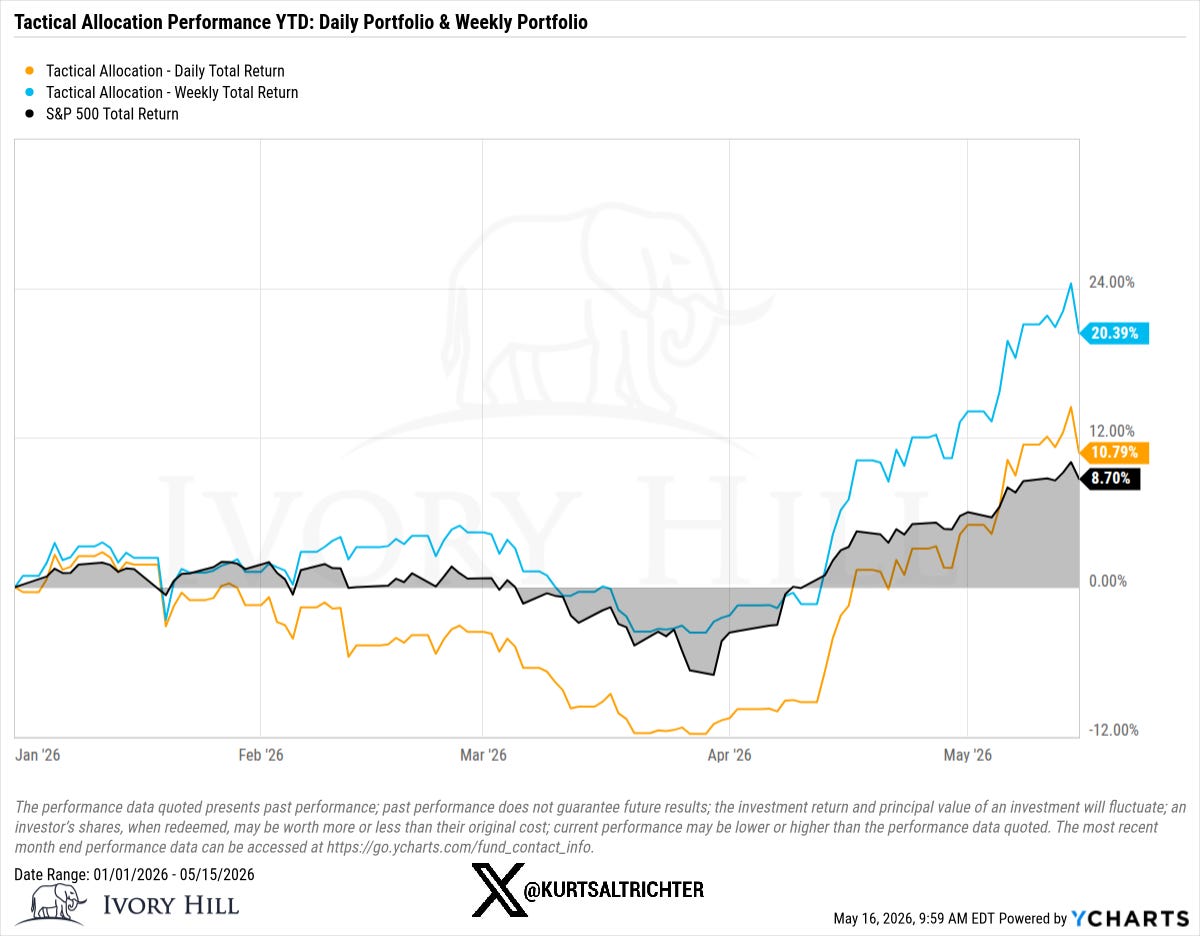
TACTICAL ALLOCATION PERFORMANCE
The conditions that would shift the regime: a sustained breadth deterioration back below 40%, a vol spike that breaks the 1-month RV above the 3-month, a gamma flip breach on a closing basis, or systematic fund flows reversing to net selling. None of those are present today.
And remember - The one fact pertaining to all conditions is that they will change.
Feel free to use me as a sounding board.
Follow me on X for more updates.
Best regards,
Schedule a call with me by clicking HERE
Kurt S. Altrichter, CRPS®
Wealth Advisor | President
Disclosure
The Gamma Report is published by Ivory Hill, LLC. All opinions and views expressed in this report reflect our analysis as of the date of publication and are subject to change without notice. The information contained herein is for informational and educational purposes only and should not be considered specific investment advice or a recommendation to buy or sell any security.
The data, models, and tactical allocations discussed in this report are designed to illustrate market structure and positioning trends and may differ from portfolio decisions made by Ivory Hill, LLC or its affiliates. Investing involves risk, including the possible loss of principal. Past performance is not indicative of future results.
Ivory Hill, LLC, and its members, officers, directors, and employees expressly disclaim any and all liability for actions taken based on the information contained in this report.