
Santa Rally or Sucker’s Rally?
Small-caps woke up. Mega caps lost altitude. Volatility will not break lower. This is the moment the tape tells you what matters going into year-end.

Happy Thanksgiving!
Thursday, November 27: Thanksgiving Day - all domestic markets will be closed.
Domestic Equity Markets and the Bond Market will be closed in observance of this holiday. In addition, Ivory Hill will also be closed. Friday, November 28 - our offices will be closing early at 12:00 PM (CST).
For your ease, we are including a link to the NYSE Holiday Schedule for 2024.
The Ivory Hill RiskSIGNAL™ has stabilized and remains green. We have started increasing our high-beta exposure this week.
On the surface, this looks like a friendly tape. VIX in the mid-teens. S&P futures are grinding higher. Small caps are finally waking up. If you only glanced at the surface, you would think risk is cheap, and the worst is behind us.
Under the surface, the message is very different.
Volatility has quietly lifted off the floor and refuses to go back. The VIX term structure is steep, not inverted. Dealer gamma has flipped positive across SPX, NDX, and RUT. The number of stocks trading above their 200-day MAs is above 50%, while the Mag 7 has pulled back double digits and lost leadership.
This is what a rotation looks like, not a collapse. The trick is to be early on the rotation without getting cute with risk.
Given the negativity out there with the market barely off all-time highs, I think it is worth repeating here. Below is the unedited version of what I posted on X last week:
The amount of negativity out there is getting comical. If you are still looking for a dramatic structural break to validate this drawdown, I have news for you. Nothing structurally broke at the end of October 2025. Nothing. Not a single systemically important gear slipped. No hidden leverage monster crawled out of the closet. No shadow bank vaporized. No Lehman. No Archegos. No 2020 liquidity air pocket. Just the performance-chasing class screaming into the void because the tape stopped handing out the effortless gains that convinced them they were investment prodigies.
What actually happened? The same thing that always happens when liquidity tightens at the wrong moment. You had cyclical liquidity strains building for months. You had policy uncertainty rising because the Fed cannot commit to a direction and fiscal policy is more chaotic than the average meme stock Discord server. Then the government shut down in late October because Congress excels at manufacturing crises out of personal and political gain, and that predictably lit sentiment on fire. Congratulations. The machine did exactly what it was programmed to do.
And the geniuses on FinX immediately jumped to “the entire system is breaking.” Really? Where? Bank reserves stabilized after the QT unwind. Credit markets are not blowing out. No meaningful wave of defaults. Commercial paper is functioning. Repo markets are boring again. Funding markets are not even sweating. Every indicator you would look at for a real structural failure is basically telling you to stop hyperventilating.
The 3% decline is sentiment driven and flow driven. People got crowded, levered, and lazy. Then they panicked when the liquidity tide went out for a few weeks. This is what markets do. They shake out the late-to-the-party crowd. They punish overconfidence. They force you to respect the cycle instead of trading on “vibes” and Tom Lee’s latest seasonality sermon.
So if you want to keep spinning ghost stories about “the market breaking,” be my guest. But the data is not on your side. The system is intact. The market is acting exactly like a market dealing with tightening liquidity, policy nonsense, and humans behaving like humans. In other words, completely normal.
If you want to survive this game, stop waiting for a fictional “Big Short” moment and start paying attention to what actually drives cycles. Otherwise you will spend your entire career blaming phantom monsters instead of your own positioning. Wait for actual long-term structural forces to prevail before you panic and just do what the market is giving you. And by the way, if you can’t stomach a 20% drawdown, then you have no business investing in stocks.
This matters today because the drawdown has stayed shallow, the internals have actually improved, and yet the fear narrative has gotten louder. The emotional cycle is out of sync with the data cycle.
Volatility: The Fear Index
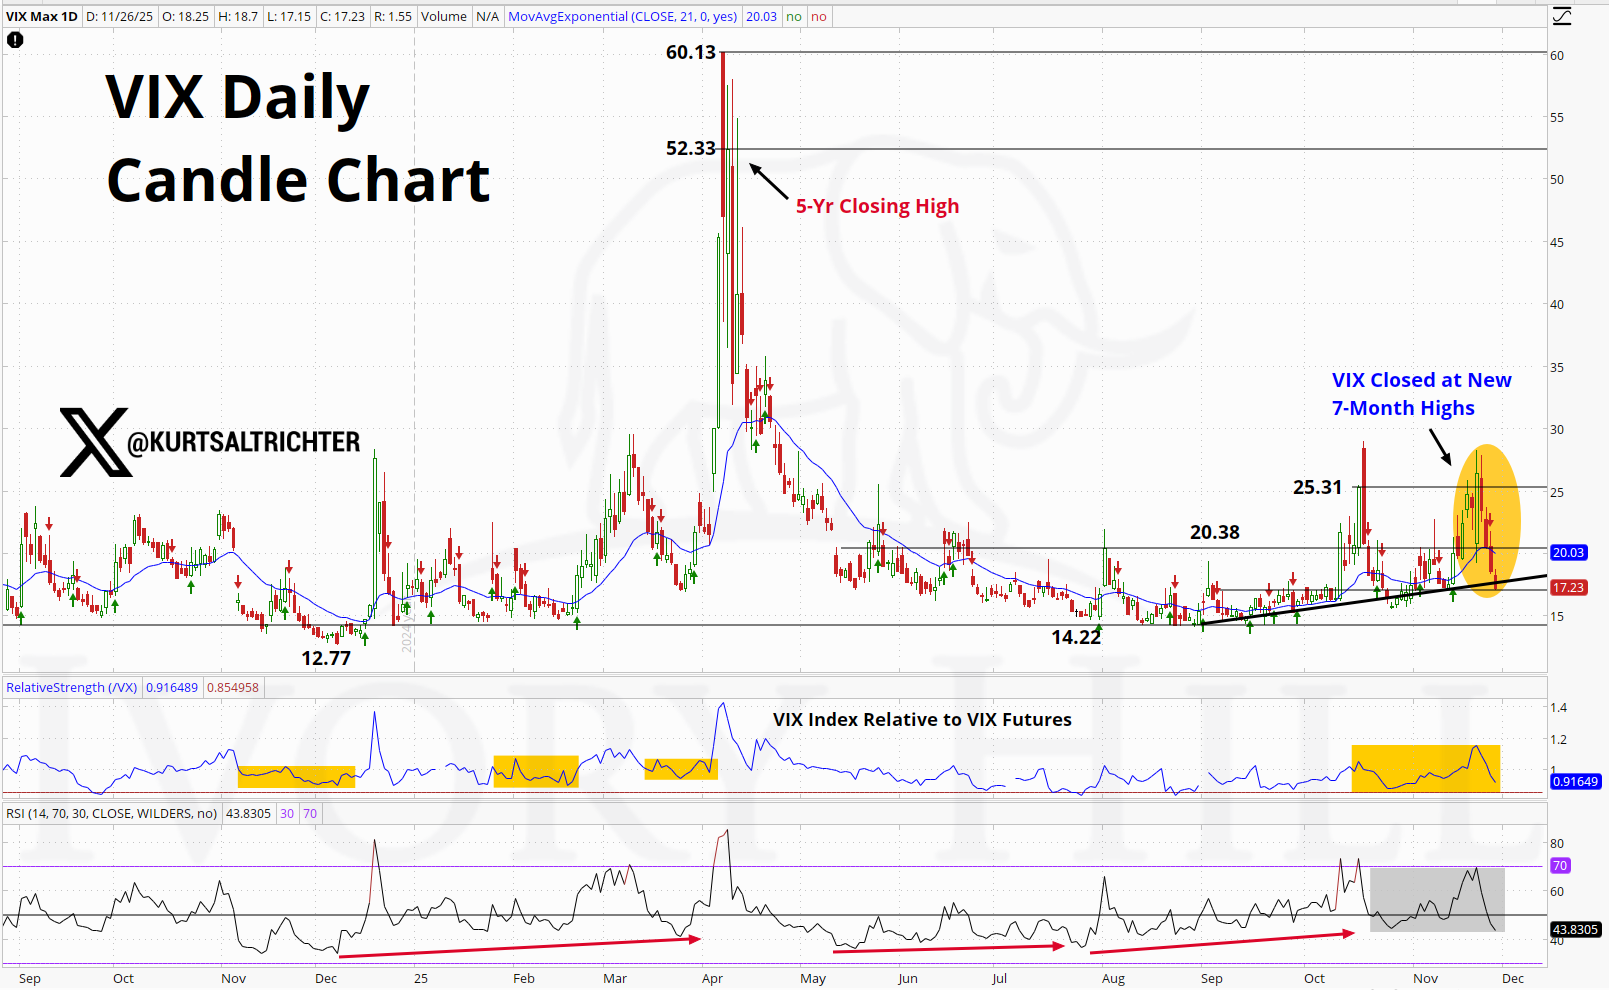
The VIX is not blowing out. It is not at crisis levels. It is sitting in the mid-teens, roughly 17 on your chart, after living near 13 to 14 for most of the summer.
That move is small in absolute terms, but important in rate-of-change terms. A VIX that goes from 13 to 17 while the S&P 500 is only a few percent off highs is not complacency.
The headline VIX number looks calm, but the behavior is not relaxed. This is the kind of backdrop where people get lulled in by low prints, only to get hit when volatility finally jumps.
VIX Term Structure: Steep, Not Inverted

There is a big difference between fear and steep contango. This spread is telling you we have the latter.
The December–January calendar spread is sitting near the top of its one-year range, around 1.4. That is a healthy, steep curve, not an inverted one. Inversion and backwardation only occur when the spread breaks below zero into that red zone at the bottom. It has not done that here.
Instead, we have seen:
Two violent collapses in the spread in early October and again in November, both highlighted by yellow ovals. Each shock drove the curve toward flat but never into backwardation.
After each shock, the spread snapped back quickly, confirming that vol sellers are still very active and willing to lean into any panic.
RSI spent time in the overbought band and has pulled back to the mid-50s while price remains elevated. That is classic digestion after a strong move, not an early sign of inversion.
So the message from the term structure is simple: near-term volatility is firming, but the broader curve is still healthy. When that is paired with a VIX in the mid-teens and a rising line of higher lows, you get a market that wants to stay stable until something pushes it out of the lane.
Dealer Gamma: The Tape Is Still Supported

The gamma chart dashboard of the S&P 500, Nasdaq 100, and Russell 2000 ties the vol picture together.
SPX net gamma has ripped back into positive territory after spending a meaningful stretch below zero. That is the big bar in the upper panel.
NDX and RUT net gamma have both climbed back above the line, moving from deeply negative to modestly positive.
Positive gamma means dealers tend to buy weakness and sell strength, which acts as a stabilizer. The important nuance here is size. This is not an extreme positive gamma regime that kills all volatility, but it is enough to make spills harder and rips choppier.
Put differently, the market is not set up for an air pocket right now. It is set up for grinding rotation inside a supported range.
Small Caps Are Defending
The Russell 2000 has quietly done something it has not done in a long time: it held a key level twice and launched higher.
On the surface, this looks like a textbook exhaustion selling followed by an aggressive relief rally. When small caps outperform after washing out, it can be a sign that risk appetite is shifting under the hood. We increased exposure to small-caps today.

Breadth: Above the 50% Line Again
Breadth is the most important structural tell in the entire stack of charts.
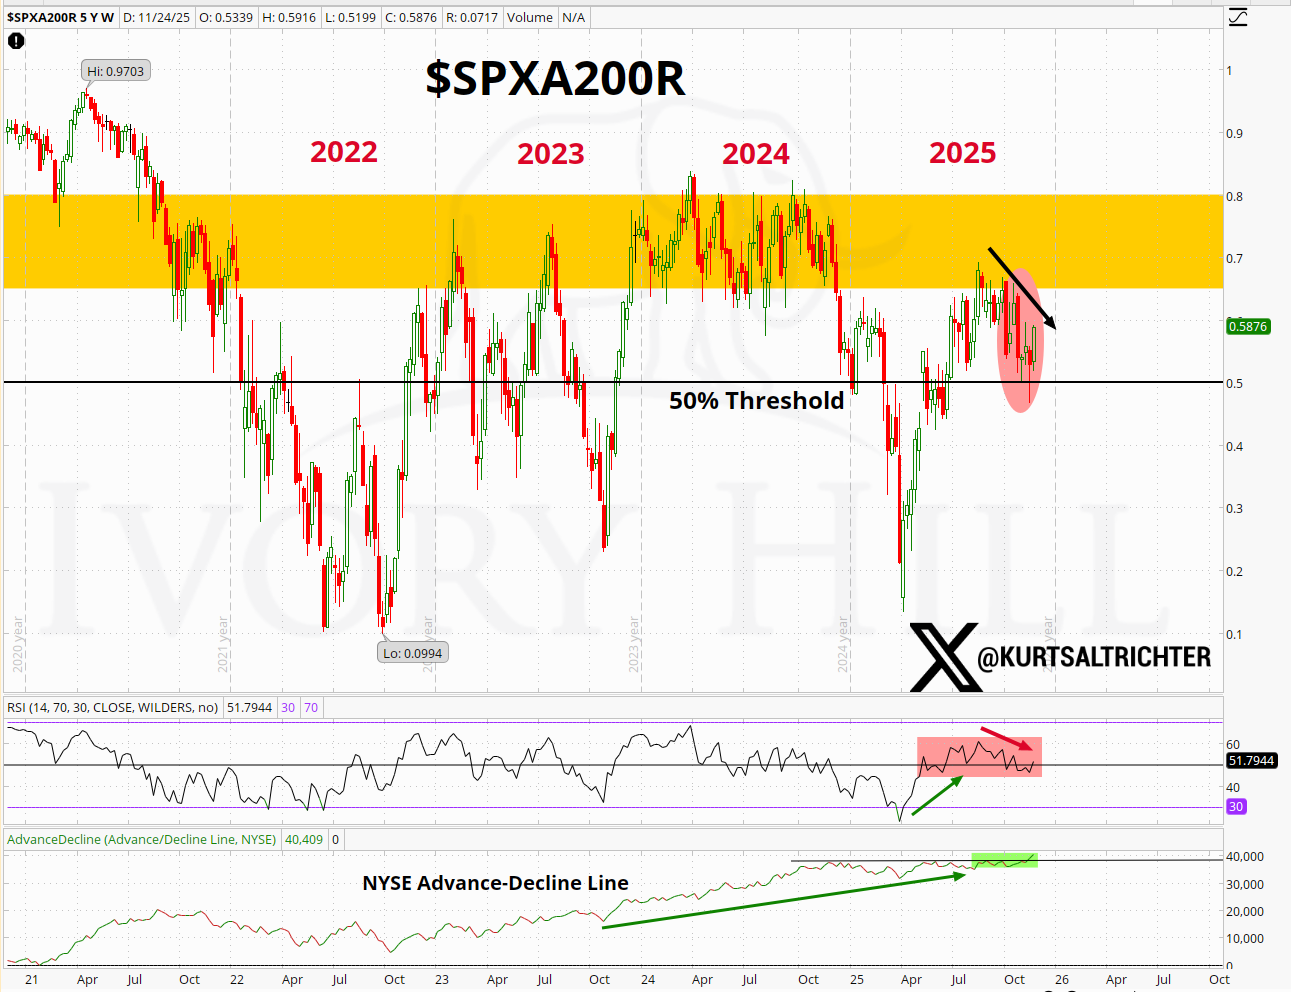
The percentage of S&P 500 names above their 200-day moving average has climbed back above the 50% threshold and now sits near 0.59.
The yellow band from roughly 0.6 to 0.8 marked the “healthy but not euphoric” zone during 2021, 2023, and early 2024. We are back flirting with the bottom of that band after the autumn hit.
The short-term pattern inside the red oval shows a series of lower highs, which tells you participation is improving but not surging.
RSI backed off an overbought spike and is now holding near 52 inside a tight red box. No breakdown, just digestion.
The NYSE advance-decline line at the bottom of the chart never lost its long-term green uptrend line. It pulled back, then pushed to fresh highs again.
When breadth holds above 50% and the AD line makes new highs, bad things usually do not happen on the index level. You can have rotations, corrections, and sector-level pain, but the odds of a sustained bear market go down.
Mag 7: Leadership Has Taken a Real Punch
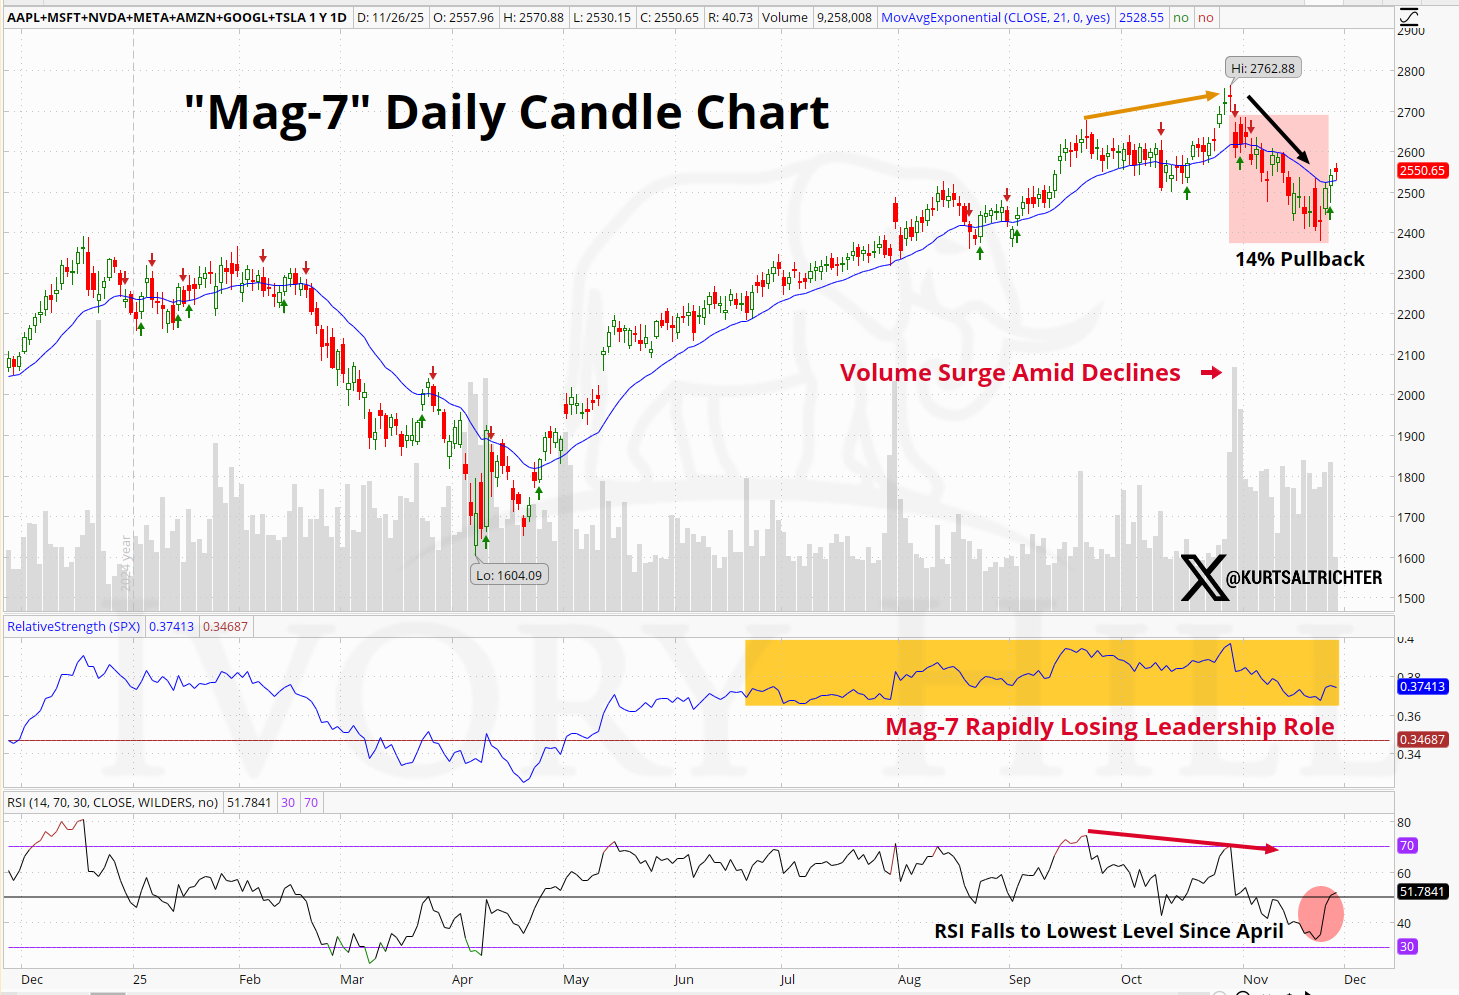
The Mag 7 composite finally did what everyone said it could not do: it actually went down!
From the high of 2,762.88, the index gave back roughly 14% (the shaded pink box)
The most important detail is volume. Volume expanded on the down days inside that pink box, confirming actual selling, not just a lack of buyers.
Relative strength versus the S&P 500, which lived inside a big yellow “outperformance” zone all year, has rolled over hard at the right edge of that box.
RSI fell to its lowest level since April, highlighted by your red circle, which marks a true loss of momentum.
This is not the end of the Mag 7 story, but it is a clear regime change. The tape is no longer a one-factor bet on a handful of names. Leadership is now contested, and that is healthy.
From a risk standpoint, this is constructive for the market, but dangerous for anyone who built their portfolio on a single crowded trade.
S&P 500 Futures: Rangebound With a Clear Ceiling
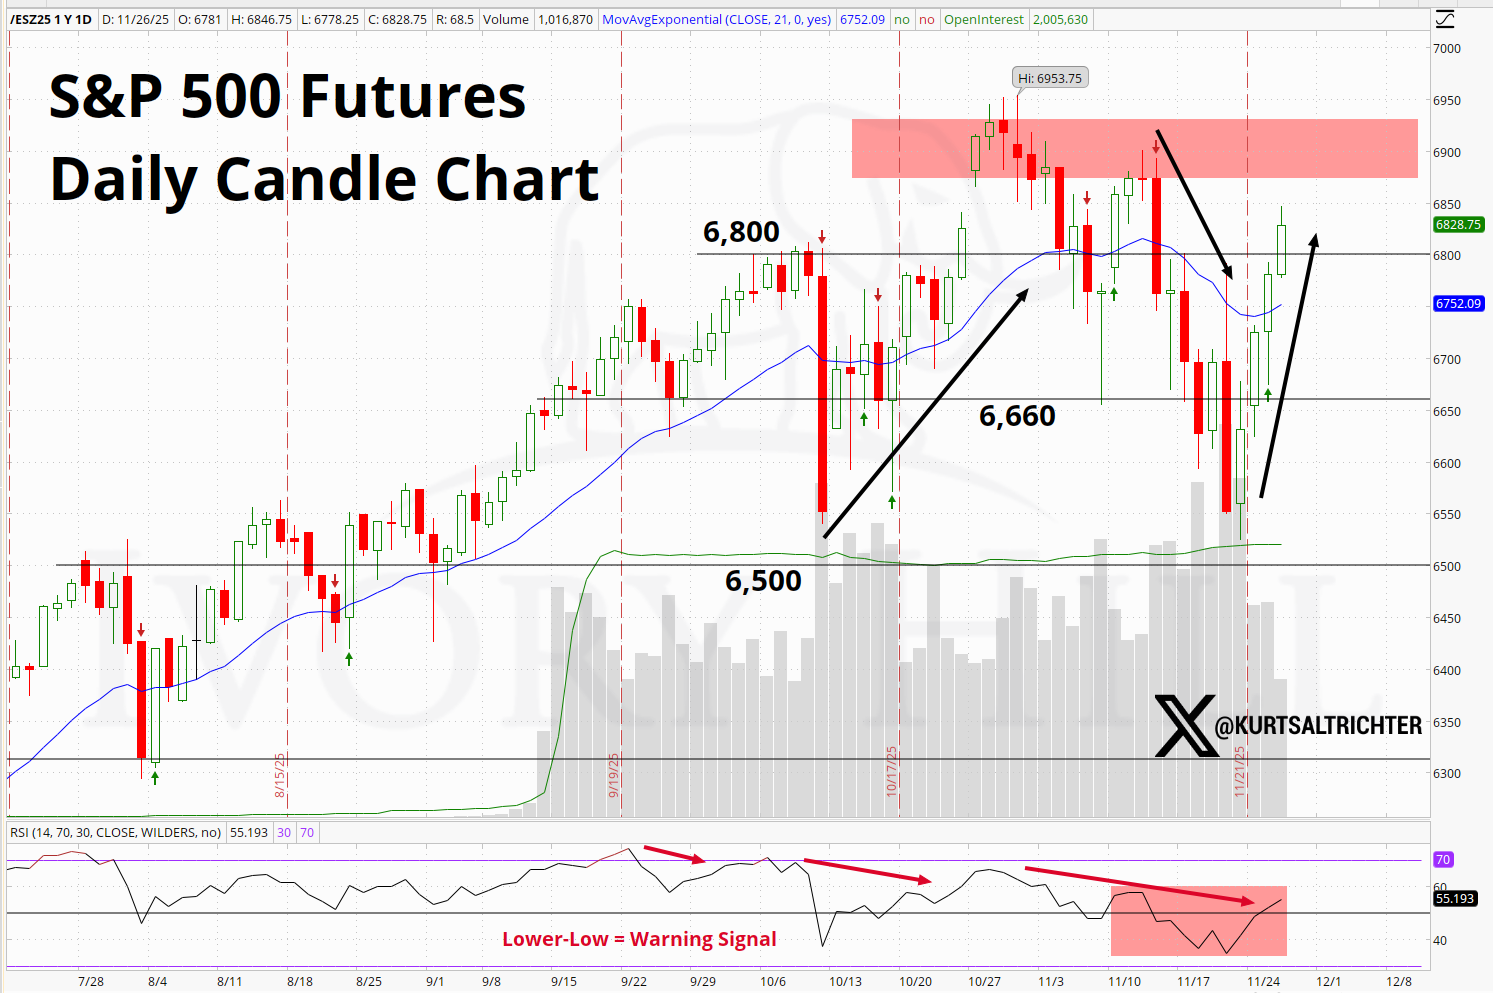
The S&P 500 futures are stuck in a very clear structure.
The 6,800 level is a key horizontal pivot. Price has repeatedly tested that area from both sides. Above it, the 6,900 to 6,950 zone, shaded in red, has rejected every breakout attempt since September.
On the downside, buyers have shown up where they needed to. First at 6,500, then at 6,660, both labeled on the chart with up-arrows. Each time, the market bounced hard.
RSI has been flashing a warning. The “Lower Low = Warning Signal” annotation in the red box at the bottom shows momentum making lower lows even as price retested the highs.
In the medium-term, this is not a trending tape. This is a range trade between roughly 6,500 and 6,900, with negative divergence telling you not to chase breakouts at the top of the band.
S&P 500 Futures Hourly: Short-Term Inflection Right Here

The hourly chart zooms in on the same message.
Horizontal levels at 6,675 and 6,775 have been the intraday battlegrounds. The most recent rally came straight off the uptrend line that connects the prior lows and now runs through 6,675.
Price is pushing directly into the red downtrend line that connects the intraday highs near 6,953.75 and 6,900. We are at that intersection now, shaded on the chart.
RSI has been stuck near 80 in the grey band at the top. Each overbought spike has produced a pullback, but the series of green boxes shows repeated bullish reversals from oversold back above the 50 line.
Short term, this is do-or-die for the bulls. Clear 6,900 with RSI holding above 60 and the range breaks higher. Fail again, and the next stop is a test of 6,775 and probably 6,675.
Historical Context: Buying High Has Not Been Punished
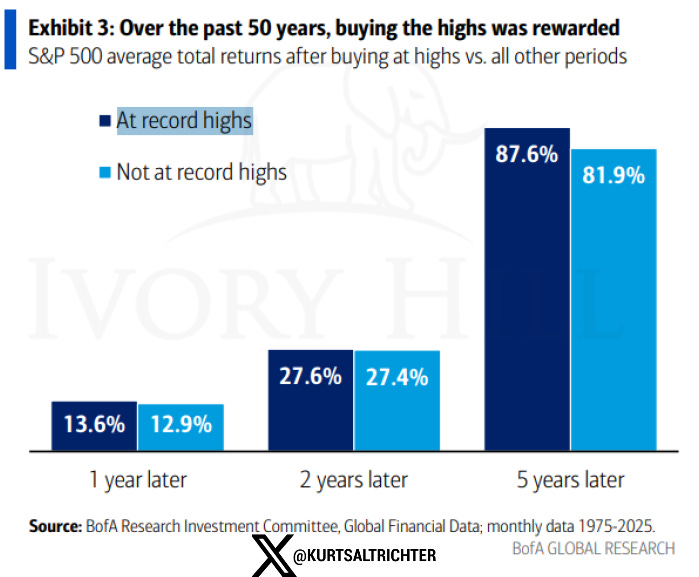
The emotional narrative says, “Never buy highs.” The data says that it is nonsense.
The chart from BofA shows:
One year after buying at record highs, average total returns have been slightly better than buying at non-record levels.
Two years later, the numbers are basically identical.
Five years later, buying at record highs has actually done better. Roughly 87.6% vs 81.9% for “not at highs.”
The real mistake is not buying highs. The real mistake is buying at any price without understanding leadership, breadth, volatility, and gamma.
That is exactly why this current setup matters so much. We are not scared of highs. We are focused on whether the internal structure can support another leg.
A Supported Market in the Middle of a Rotation
Put it all together.
VIX is in the mid-teens, off the floor, riding a trend of higher lows.
The December–January VIX spread is steep, not inverted. Vol sellers still own the curve.
Dealer gamma is positive across SPX, NDX, and RUT, creating a stabilizing backdrop.
Breadth has climbed back above 50 percent, with the NYSE advance-decline line still in an uptrend.
Small caps have defended key levels and are trying to claw back relative performance.
The Mag 7 has taken a real punch with a 14 percent drawdown and clear loss of momentum and relative strength.
S&P futures are rangebound with a clear ceiling near 6,900 and a floor between 6,500 and 6,660.
This is not a crash setup. It is not a melt-up either.
This is a supported market in the middle of a leadership rotation. The risk is not that everything breaks at once. The risk is that you cling to yesterday’s winners and ignore the shift in volatility, breadth, and small-cap behavior.
The opportunity is to respect the range, lean on the gamma report, and slowly rotate toward the parts of the market that are quietly taking control while everyone else keeps staring at the same seven stocks.
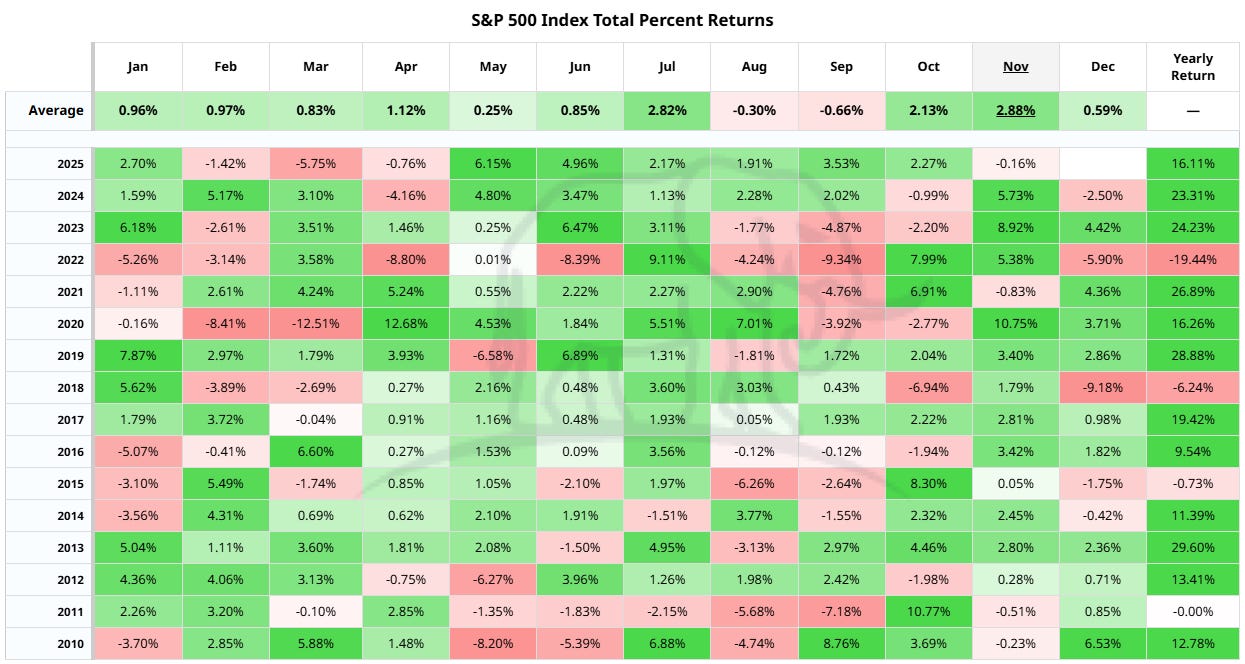
Santa Rally Setup Into Year-End 2025
If there is one seasonal pattern that actually matters, it is the final three to five weeks of the year. Not because Santa shows up, but because positioning, taxes, and liquidity stack the odds in a very specific direction.
This year is lining up to follow that same script, but with a twist.
The usual ingredients for a year-end rally are all in place:
Dealer gamma flipped positive across SPX, NDX, and RUT, which naturally compresses volatility and makes downside harder.
Breadth has recovered above the fifty percent line, which historically is the minimum level needed for a sustained move into year-end.
Small caps just put in a clean reversal, which often adds fuel in the final weeks because they react fastest to reallocations.
The Mag 7 just went through a real correction, not a shallow dip, which means the market has already absorbed the most obvious source of crowding risk.
But here is the big hairy BUTT.
The VIX sitting in the mid-teens with a string of higher lows tells you volatility is underpriced relative to how the tape is trading. Seasonal tailwinds do not erase that. They simply sit on top of it.
So instead of the classic melt-up that people imagine when they hear “Santa rally,” the more realistic setup is this:
A grinding, rotational rally where indices can push toward the top of their ranges, but leadership shifts beneath the surface. Mega caps stop carrying the market. Breadth expands. Cyclicals, small caps, and anything washed out catch a bid. Volatility stays firm even as prices grind higher.
The setup is there. The seasonality is there. The internal structure is stable enough to support an end-of-year push.
Just do not expect a straight line. This Santa rally is more likely to be a rotation-driven march than a runaway melt-up.
Perfect for disciplined investors. Dangerous for the fast-money crowd.
And remember - The one fact pertaining to all conditions is that they will change.
Follow me on X for more updates.
Best regards,
-Kurt
Schedule a call with me by clicking HERE
Kurt S. Altrichter, CRPS®
Fiduciary Advisor | President
Disclosure
The RiskSignal Report is published by Ivory Hill, LLC. All opinions and views expressed in this report reflect our analysis as of the date of publication and are subject to change without notice. The information contained herein is for informational and educational purposes only and should not be considered specific investment advice or a recommendation to buy or sell any security.
The data, models, and tactical allocations discussed in this report are designed to illustrate market structure and positioning trends and may differ from portfolio decisions made by Ivory Hill, LLC or its affiliates. Investing involves risk, including the possible loss of principal. Past performance is not indicative of future results.
Ivory Hil, LLC, and its members, officers, directors, and employees expressly disclaim any and all liability for actions taken based on the information contained in this report.
Excellent post. Thank you Kurt, and happy Thanksgiving!