

Last week was not about direction. It was about limits.
Price held above key structural levels, but progress was limited. Volatility stopped cooperating. Participation improved without expanding. The tape stayed balanced, not weak.
This is the transition phase most investors miss. When risk is still supported, but no longer cheap. When discipline matters more than conviction.
As of the close on 12/12/2025:
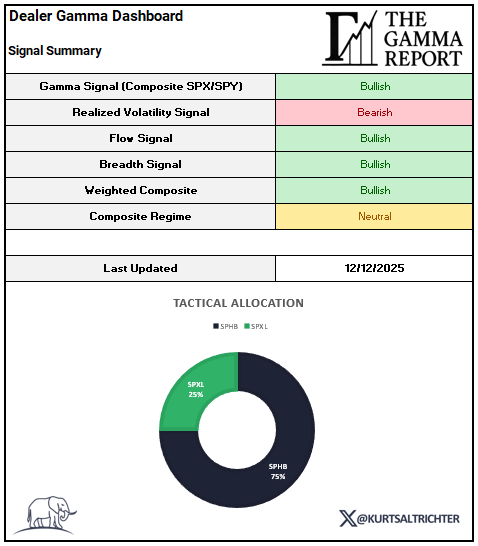
Gamma Signal: Bullish
Realized Volatility Signal: Bearish
Flow Signal: Bullish
Breadth Signal: Bullish
Weighted Composite: Bullish
Composite Regime: Neutral
Weekly Allocation: SPHB 75% | SPXL 25%
Gamma Signal: Bullish
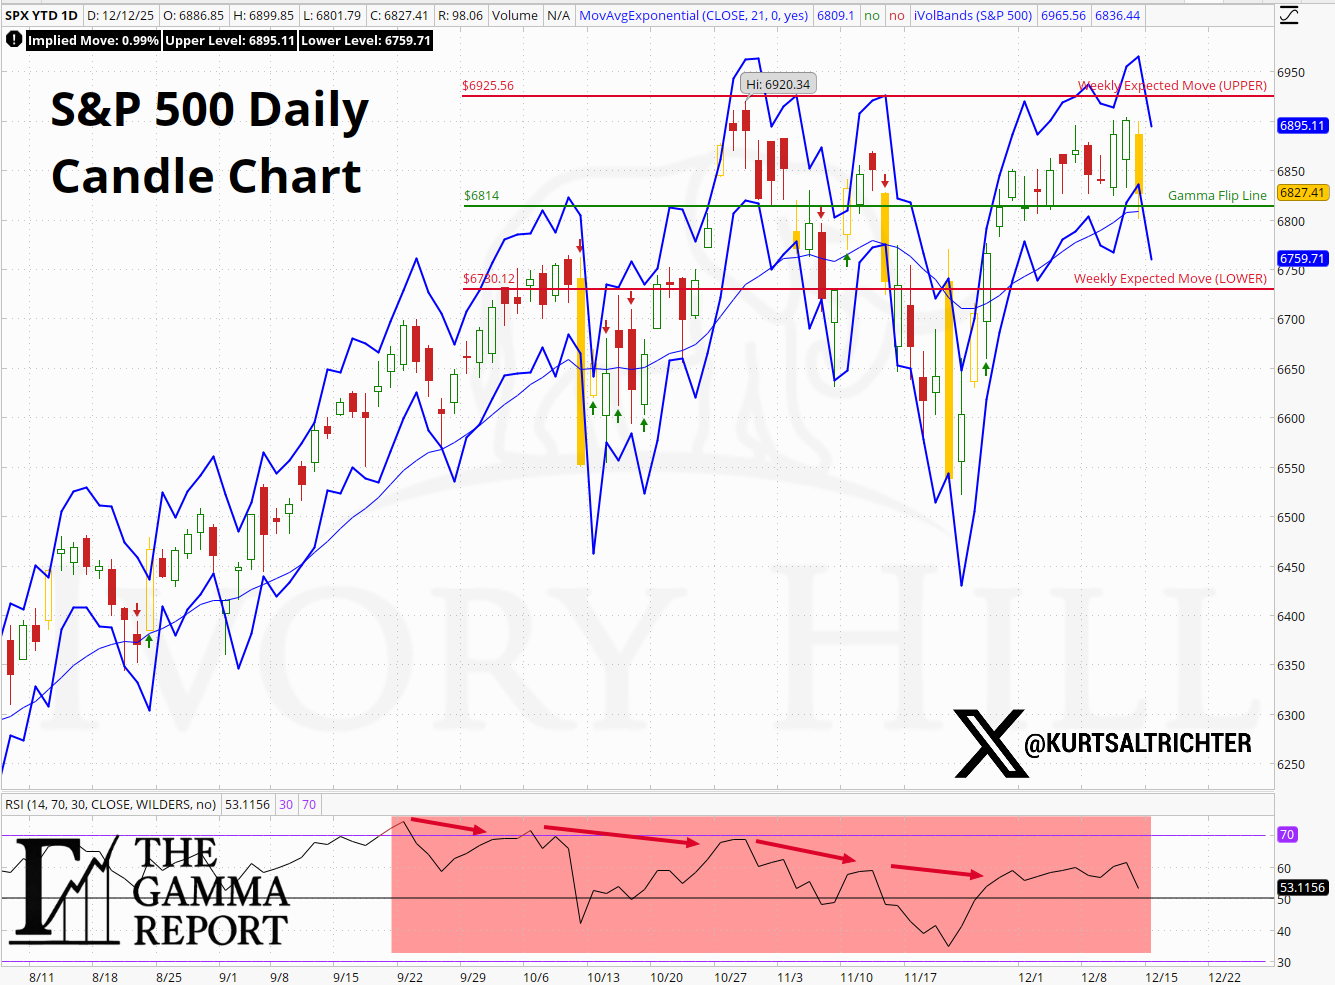
The S&P 500 spent the entire week above the gamma flip line and stayed within the expected move lines of last week’s chart.
The flip line rose steadily throughout the week and now sits near 6793, while spot closed at 6829. That keeps dealers in positive gamma and suppresses volatility on pullbacks. When the price stays above the flip line, dealers hedge against moves instead of amplifying them.
This remains a supportive structure, but it is weakening.
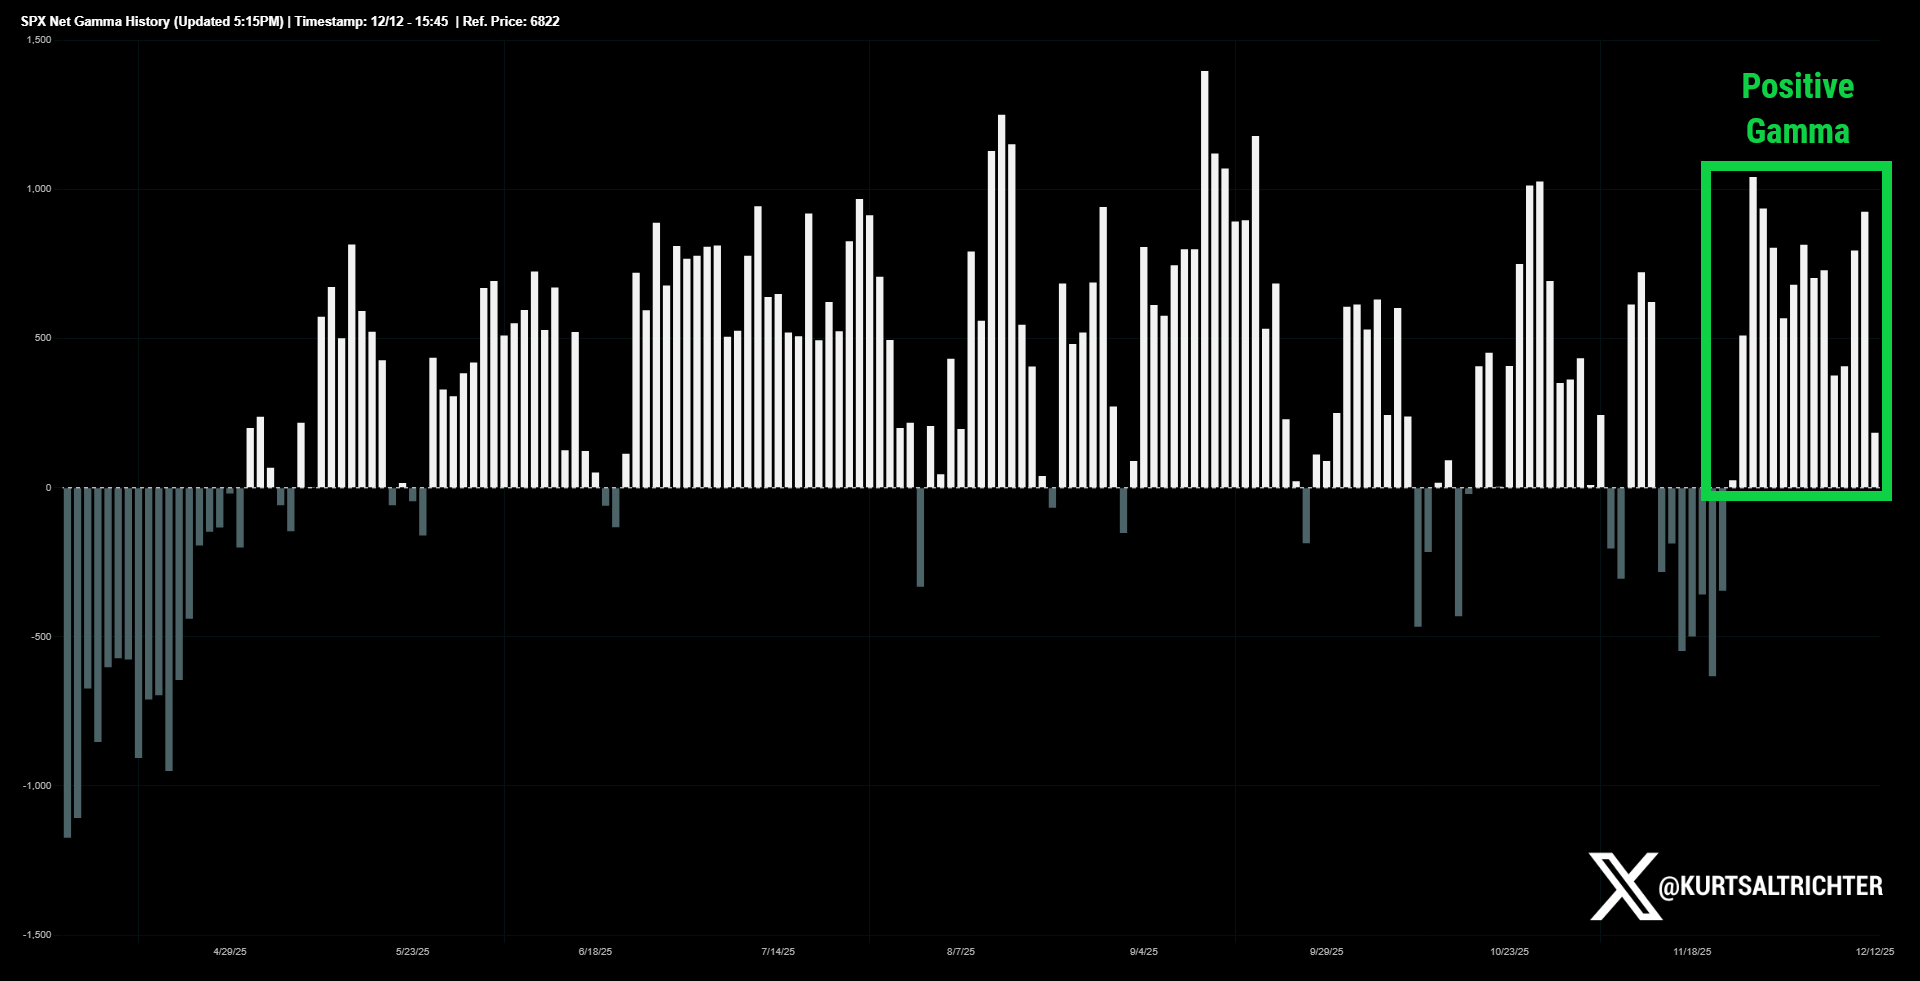
The net gamma profile remains positive. The cluster that formed after Thanksgiving is still intact but weakened.
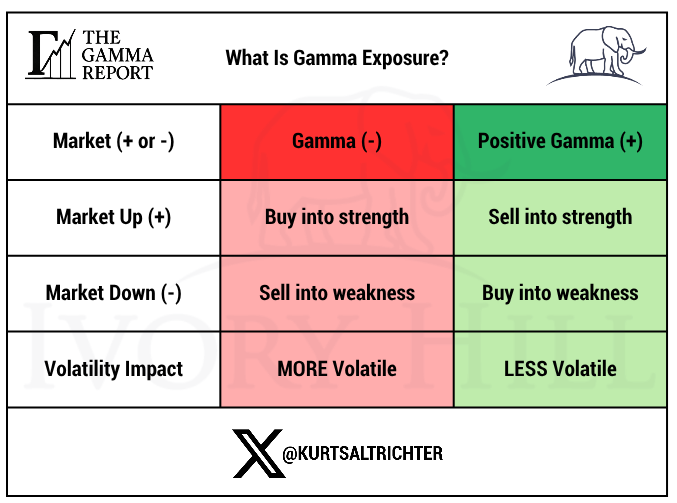
Positive gamma does not mean straight-up markets. It means moves get absorbed instead of accelerated. Sellers have to work harder. That dynamic is still in place.
Realized Volatility Signal: Bearish
This is the one component that weakened.
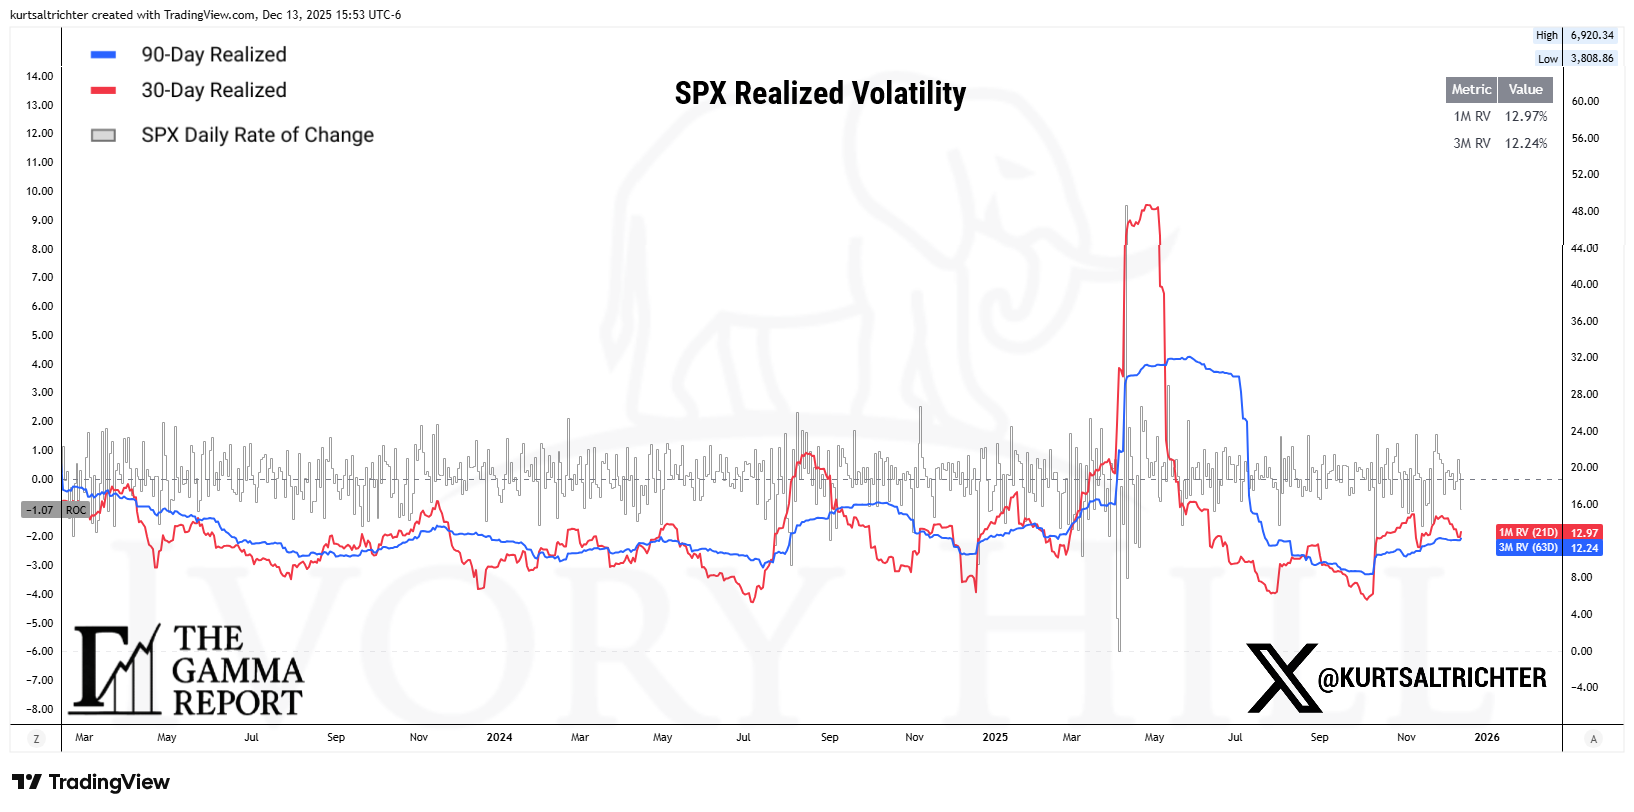
30-day realized volatility ticked back up to 12.97, while 90-day realized volatility sits near 12.24. More importantly, the short-term RV stopped falling. Volatility trades on direction, not level.
When short-term realized volatility rises, vol control funds stop adding exposure. That removes a source of incremental demand even if they are not actively selling yet.
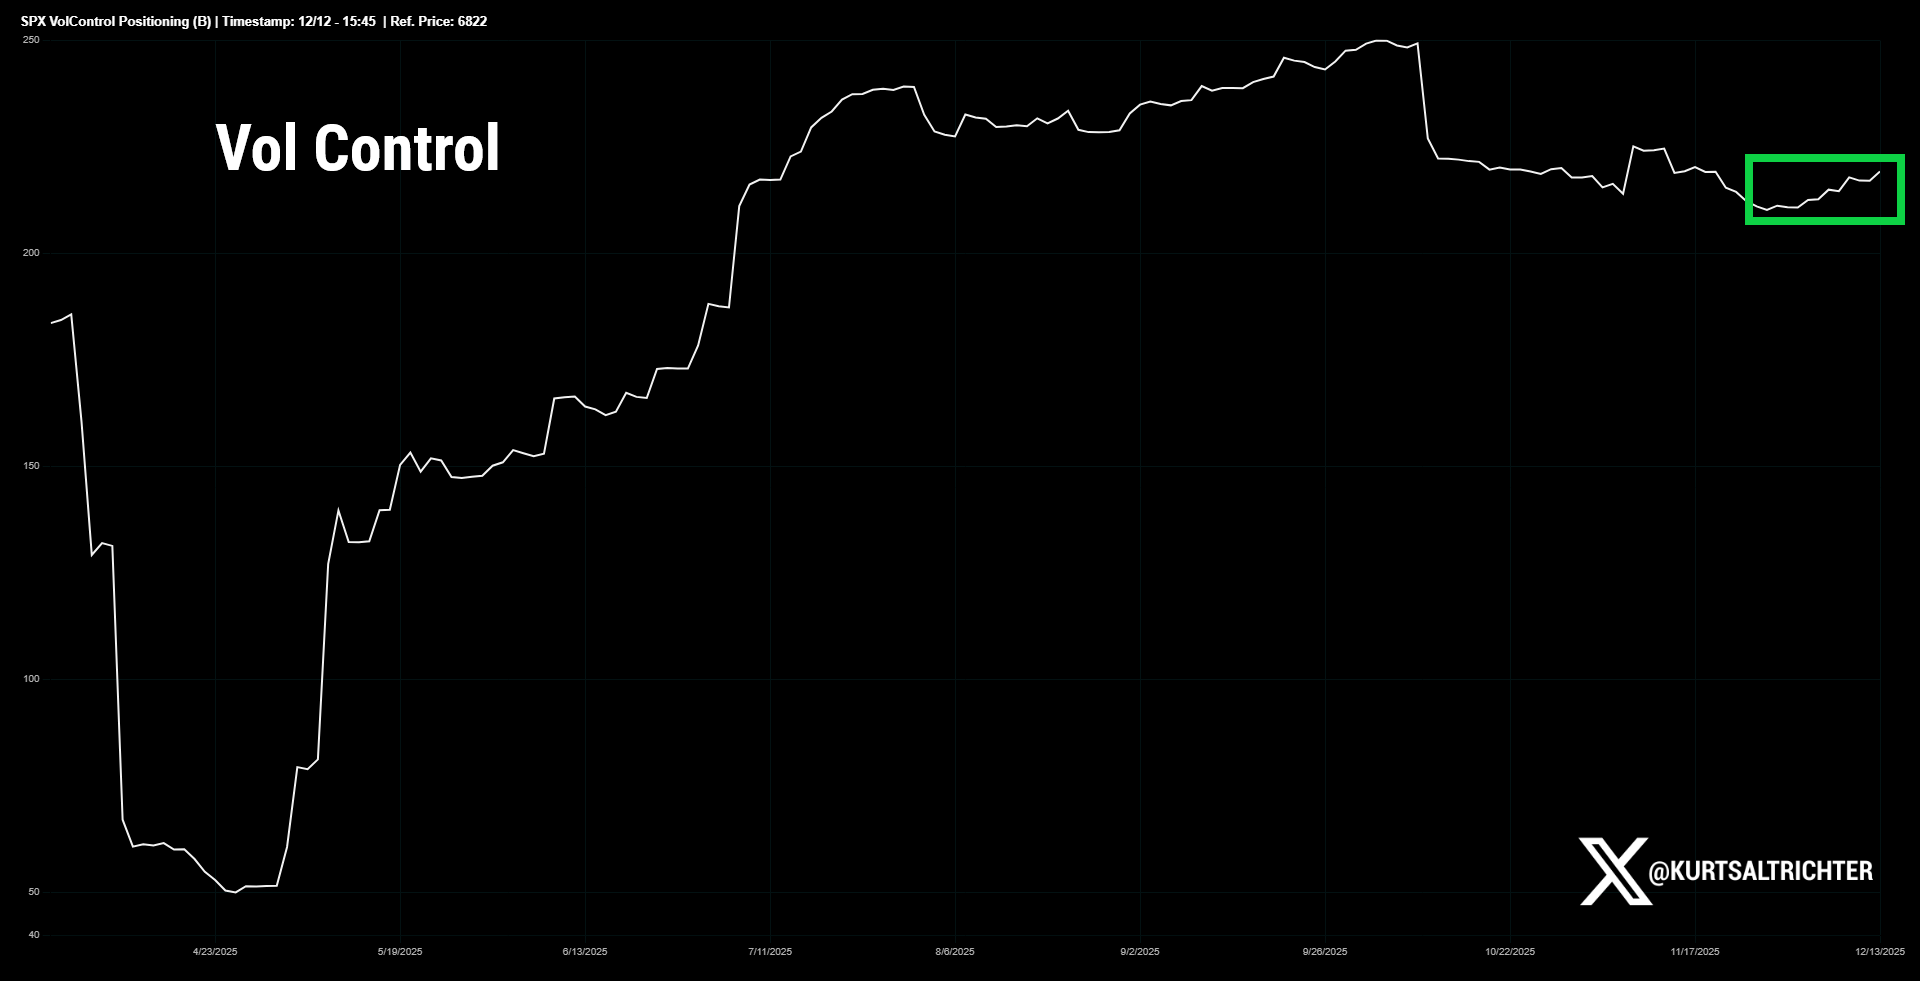
Flow Signal: Bullish
Systematic flows improved under the surface.
CTA exposure is still drifting lower but started to point up, which is typical late in a mature trend. They remain long, just no longer aggressive buyers. Vol control exposure, however, continues to stabilize and curl higher.
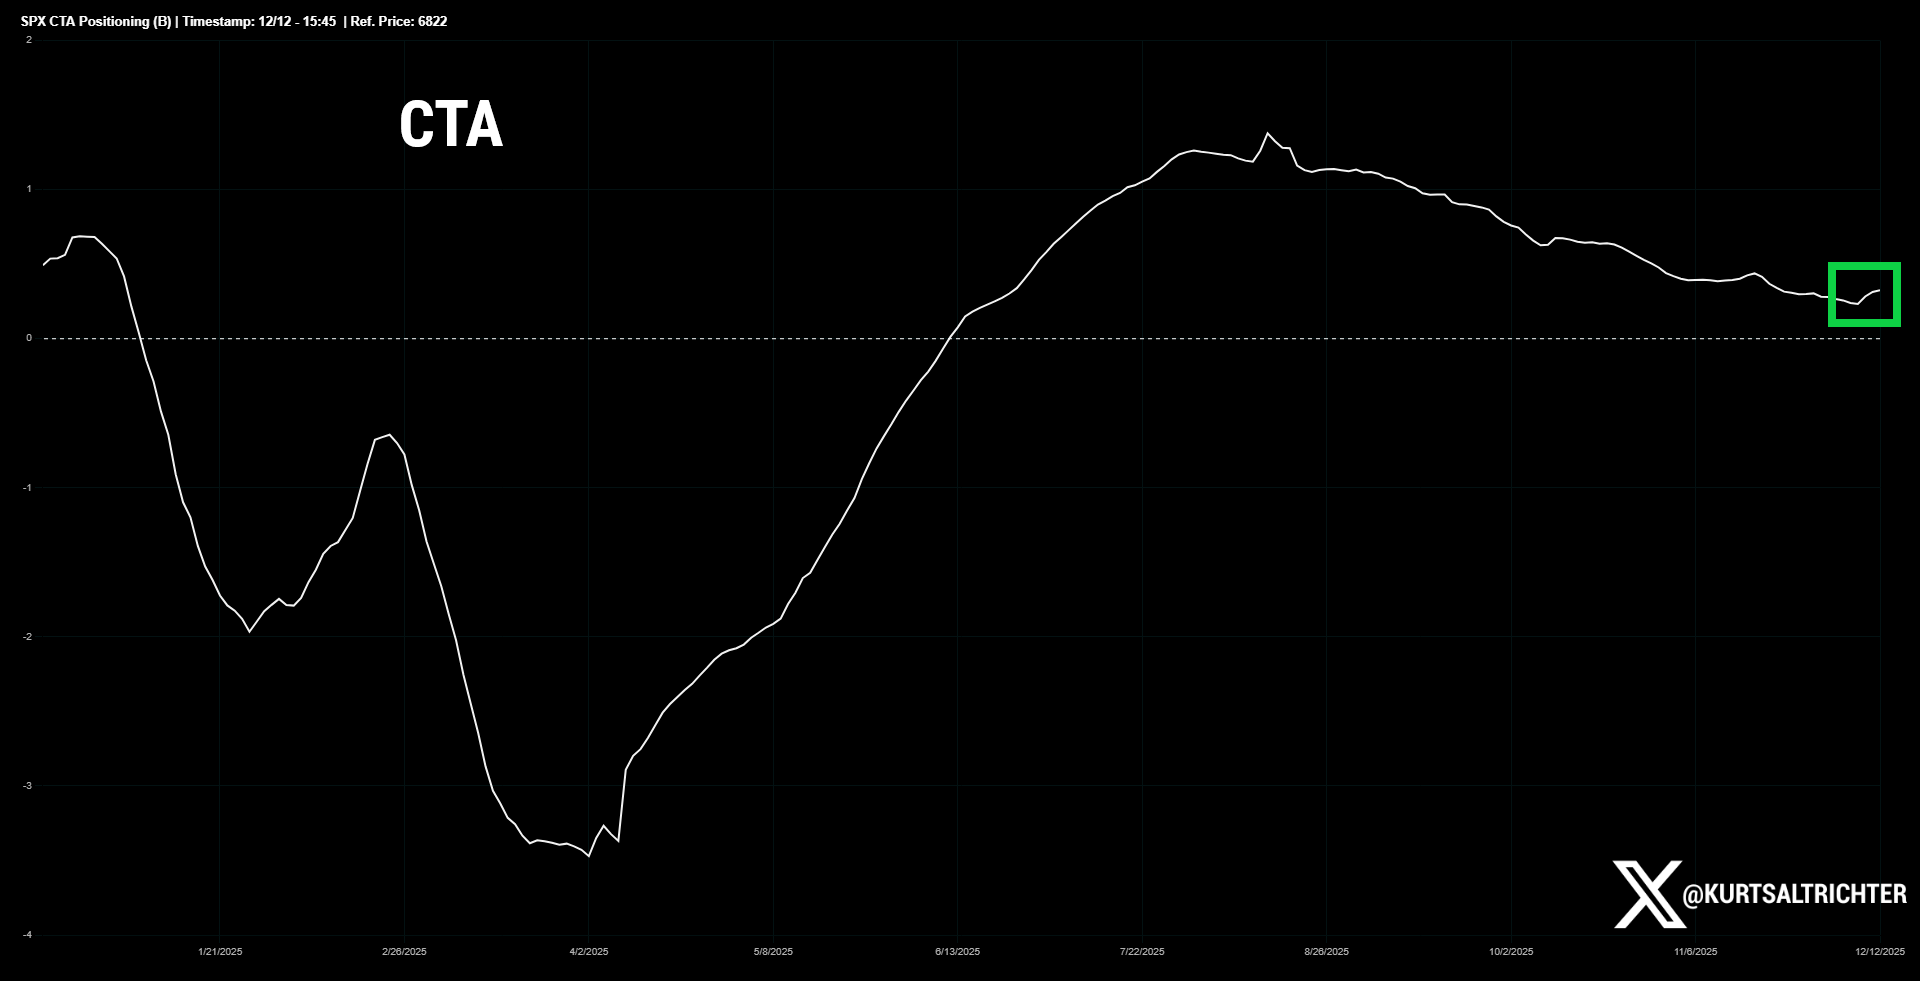
This sequencing matters. Positive gamma cools volatility. Cooling volatility allows vol control to add exposure. That supports price even when CTAs pause.
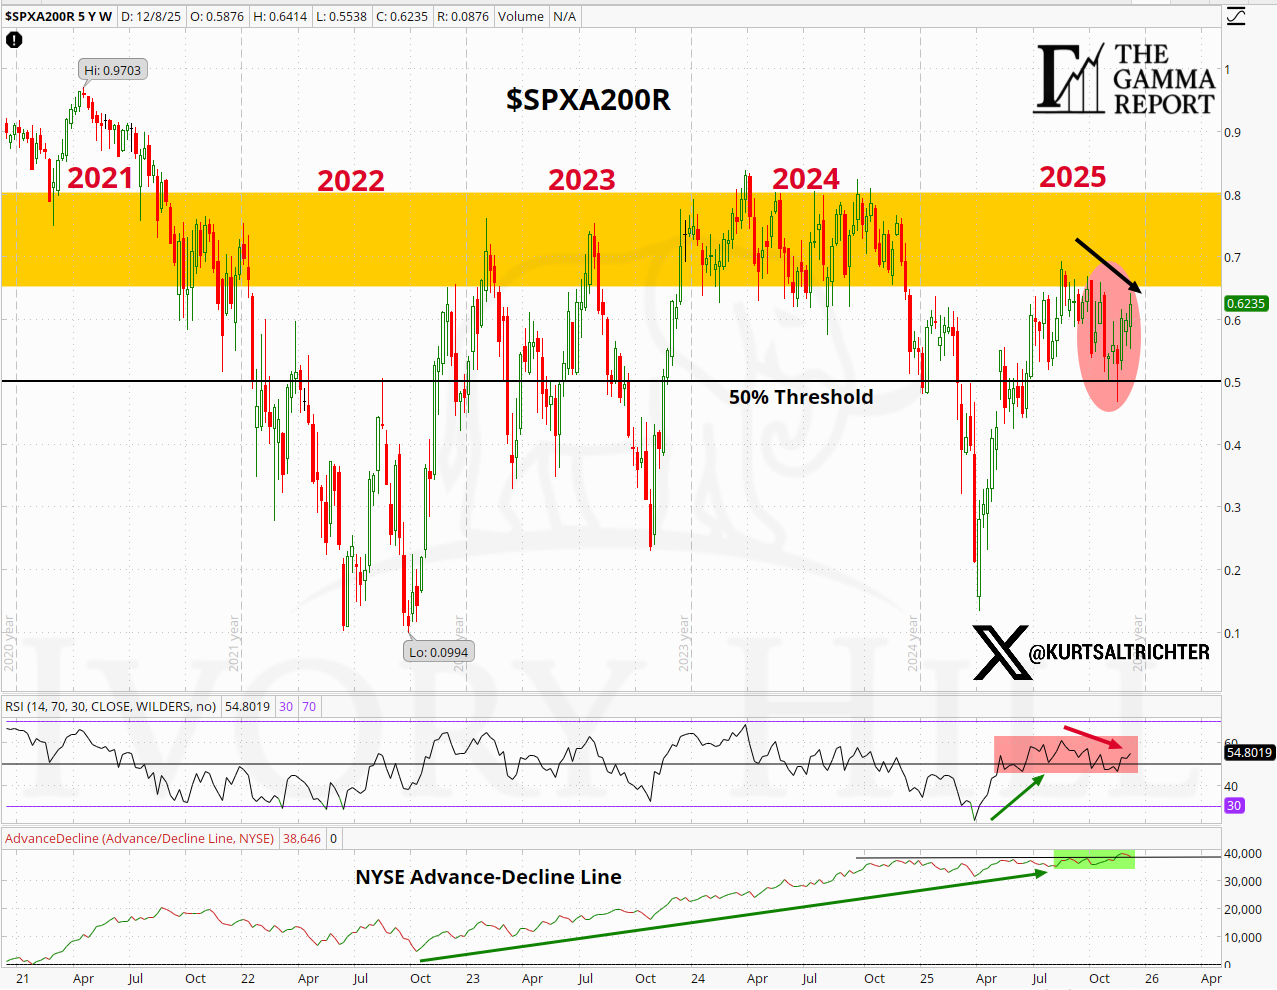
Breadth Signal: Bullish
Roughly 63% of S&P 500 names are now trading above their 200-day moving average. That is a meaningful improvement from the mid-November lows in the high 50s, but it remains inside the same multi-year congestion zone that has capped participation since 2022.
RSI for breadth stabilized above 50 but failed to push into expansion territory. The NYSE advance-decline line continues to trend higher, yet momentum has flattened over the past two weeks. This is an improvement, not confirmation.
Breadth earns a Bullish score because it is no longer deteriorating and is contributing positively to the composite.
Until breadth decisively clears this range, it supports the trend without validating aggressive upside expectations.
Weighted Composite and Regime
With gamma, flows, and breadth all scoring Bullish, the weighted composite finished the week Bullish again.
The composite regime remains Neutral. That distinction matters. A Neutral regime with a Bullish composite tells you the structure supports risk, but the margin for error is narrowing. When realized volatility refuses to trend lower, the model remains disciplined even when the price is near highs.
Neutral here is not defensive. It is selective.
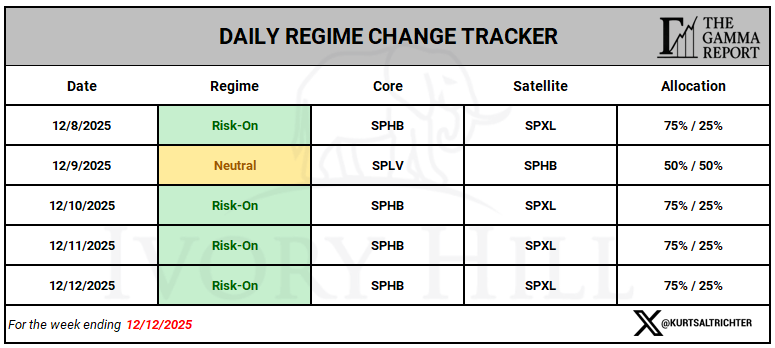
Daily and Weekly Regimes
Both the daily and weekly models finished the week in Risk-On.
There was a brief Neutral reading earlier in the week as volatility firmed, but the structure stabilized quickly.
When both timeframes align, the environment supports taking risks, as long as you respect ranges and avoid chasing stretched prices.
SPX Daily Structure
SPX remains above the gamma flip line, which continues to rise and now sits near 6.814. Spot closed the week near 6,827, keeping price in positive gamma territory.
The index reclaimed and held the 21-day moving average, but upside progress slowed near the upper half of the weekly range. This is consistent with positive gamma environments late in the cycle, where rallies compress, and pullbacks get absorbed.
Positive gamma provides a cushion. It does not guarantee acceleration.
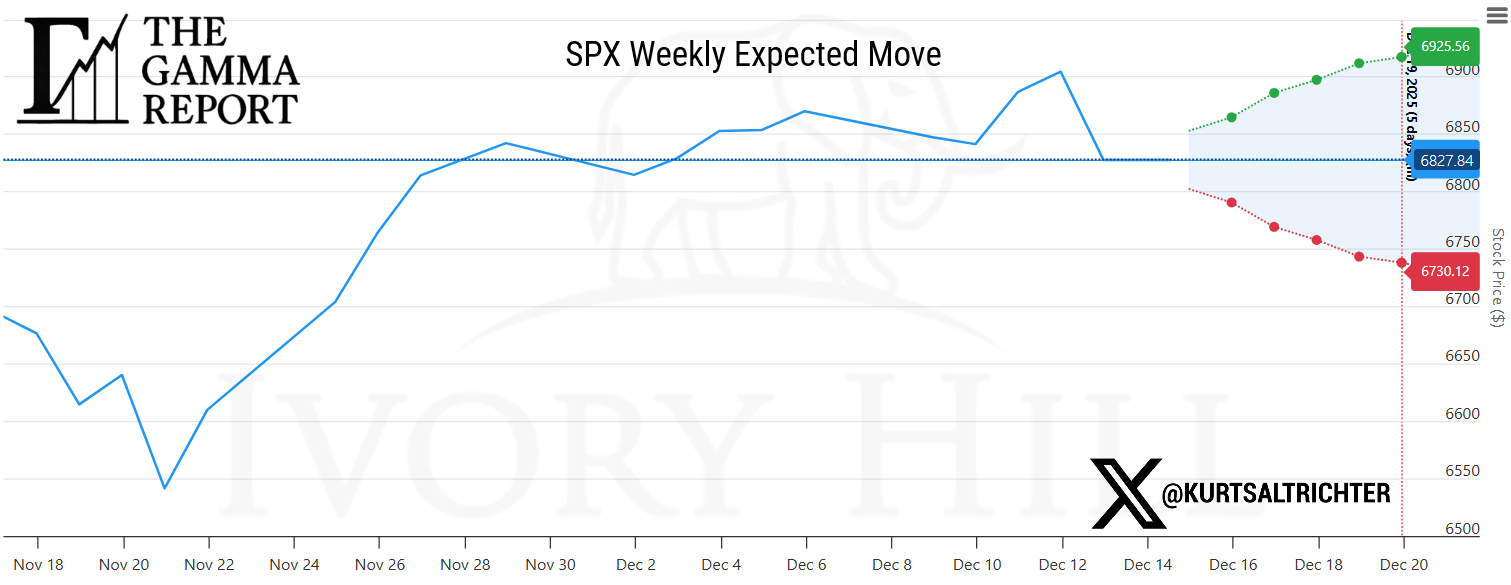
Expected Move Context
This week’s expected move range is making lower highs and lower lows.
When both the upper and lower bounds step down, the range shifts lower. The market is telling you it is willing to move less and pay you less for chasing price in either direction.
This is not outright bearish by itself. But it is a sign of deceleration.
Upside becomes harder to extend, and downside gets absorbed quickly as long as the price stays above the gamma flip line.
When the ranges make lower highs and lower lows, breakout chasing tends to stop working in the short term.
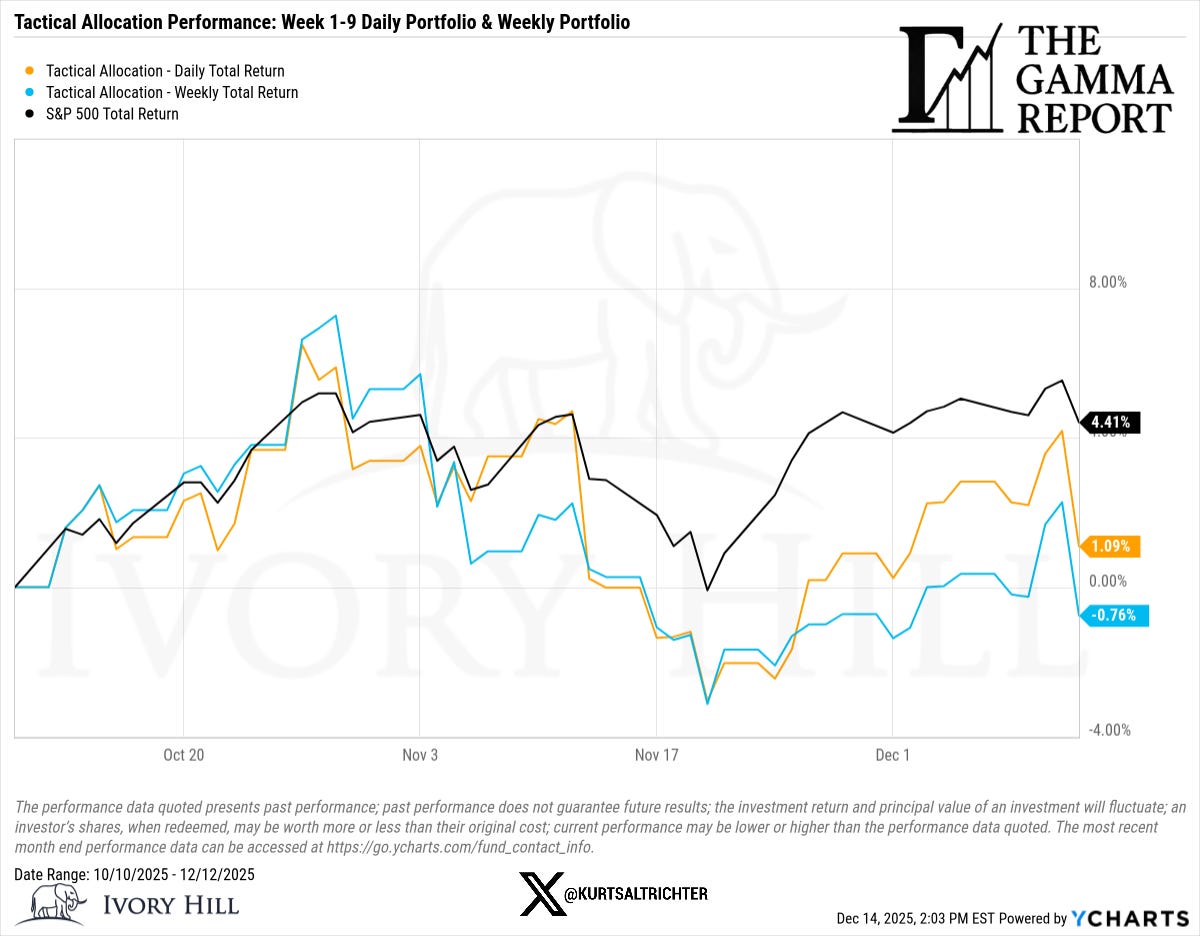
Tactical Allocation Performance
Since the tactical allocation series began on October 10:
S&P 500: +4.41%
Daily Tactical Sleeve: +1.09%
Weekly Tactical Sleeve: -0.76%
The underperformance relative to the index is not a flaw. It reflects discipline during periods when volatility stopped compressing, and upside became harder to monetize.
The daily sleeve adapts faster. The weekly sleeve trades less and suppresses noise. Both are designed to stay aligned with the regime rather than chase returns.
Bottom Line
The structure remains intact, but tighter.
Dealers remain in positive gamma
Volatility stopped falling
Flows are improving
Breadth is supportive but limited
Expected moves are showing signs of deceleration
This market can grind higher, but it does not reward impatience. Positive gamma provides stability, not immunity. Expected moves define the risk expectations.
Respect both, and you shouldn’t be surprised.
Feel free to use me as a sounding board.
And remember - The one fact pertaining to all conditions is that they will change.
Follow me on X for more updates.
Best regards,
Schedule a call with me by clicking HERE
Kurt S. Altrichter, CRPS®
Fiduciary Advisor | President
Disclosure
The Gamma Report is published by Ivory Hill, LLC. All opinions and views expressed in this report reflect our analysis as of the date of publication and are subject to change without notice. The information contained herein is for informational and educational purposes only and should not be considered specific investment advice or a recommendation to buy or sell any security.
The data, models, and tactical allocations discussed in this report are designed to illustrate market structure and positioning trends and may differ from portfolio decisions made by Ivory Hill, LLC or its affiliates. Investing involves risk, including the possible loss of principal. Past performance is not indicative of future results.
Ivory Hil, LLC, and its members, officers, directors, and employees expressly disclaim any and all liability for actions taken based on the information contained in this report.